First and most importantly, I want to acknowledge and thank these contributing authors who wrote report recipes and working samples included in this eBook:
- Robert Bruckner
- Kirill Perian
- Kathi Kellenberger
- Stacia Varga
- Tomaž Kaštrun
- Tom Martens
As I am working on posting the initial report recipes, I wanted to share some comments about the first two recipes. These recipes are step-by-step instructions that lead through the start-to-finish process using provided sample database, and can be used with SQL Server Reporting Services (SSRS), Paginated Report Server or Paginated Reports published to a Power BI Premium capacity workspace. Reports may be authored with Power BI Report Builder, Report Builder or SQL Server Data Tools/Visual Studio. Additional recipes will follow.
The eBook with all of the recipes will be accessible from the main menu here on the blog. Each recipe is published as a page rather than a post, so you don’t have to search and try to figure out when each one was originally posted. As of tonight, I have published eight of twelve recipes that have been completed thus far. I’ll get others posted in the near future. Please enjoy these and watch for more paginated report recipes here: Paginated Report Recipes eBook | Paul Turley’s SQL Server BI Blog
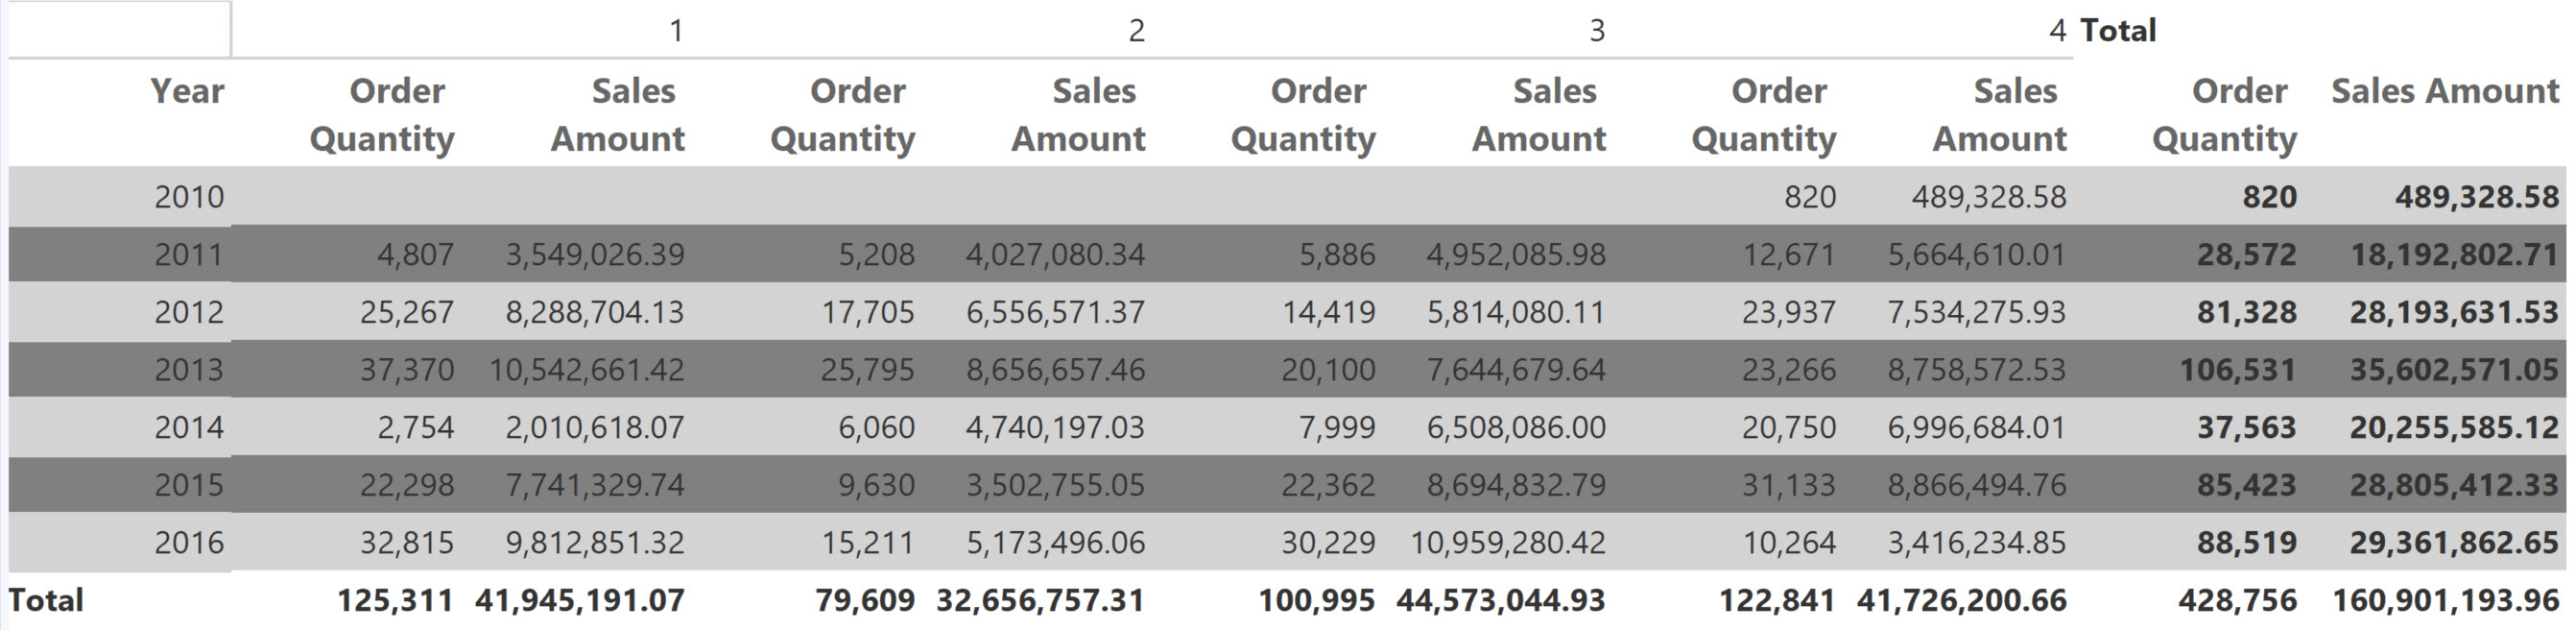
The first two recipes in the Paginated Report Recipe eBook are about applying alternate row and group shading. Dating back to the early days of printed reports, this style of reports were called “greenbar reports” because they were literally printed on continuous, pin-fed paper that had alternating shaded green and white rows to make it easier for someone reading the report to follow-along.

As the industry evolve from scrolling paper reports to laser-printed pages and then to on-screen reports, the greenbar effect was still useful. Recipe #1 introduces expression-based styling by changing the background color using the modulus (divisional remainder) of the row number in a table data region. If the row number is on odd number, set the background color to a shading color. Otherwise, set it to white or transparent.
01: Alternate Row Table “Green Bar” Report | Paul Turley’s SQL Server BI Blog
In recipe #2, contributing author Kirill Perian takes this technique to the next level by maintaining the alternate shading across column and row groups in a matrix data region. The method is a little more involved than just using the row number. He uses a hidden column to track the column group and then an expression to reference that value to manage the background shading for each row.
02: Alternate Row Shading in Matrix (with Column Groups) | Paul Turley’s SQL Server BI Blog
The end results looks similar to the simple table report using in recipe #1 but the problem is a little more complex in a matrix report because of the column groups. The advantage of this technique is that it will work across row and column groups at multiple levels.