Welcome to SSRS/Paginated Report Recipes
The first edition of this book, SQL Server Reporting Services Recipes, was published by Wiley Publishing/WROX Press in 2010
co-authored by Paul Turley and Robert Bruckner, with multiple contributing authors.
This new electronic book is a revision, in part, of the original recipes and new content modernized to work with Power BI Paginated Reports. These recipes can be used or adapted to work with SQL Server Reporting Services, Power BI Report Server or the Power BI Service in Premium Capacity (or Premium per User licensing).
2021 (c) Paul Turley, with contributions from multiple authors
Recipe Table Of Contents
- 01-Alternate Row Table “Green Bar” Reports
- 02: Alternate Row Shading in Matrix (with Column Groups)
- 03-Reusable Report Template
- 04-Drillthrough from Power BI to Paginated Report On-prem
- 05-Parsing Multi-value Parameters using OPENJSON
- 06-Sending Customized Paginated Reports to Multiple Recipients
- 07-Creating a Calendar Report
- 08-Horizontal Table Report
- 09-Customizing Gauges with Images
- 10-Histogram Chart
- 11-Dynamic Chart Sizing
- 12-Drill-Through for a Multi-Level Matrix Report
- 13-Column Chart with Goal Line
- 14-Checkbox List for Existing Records
- 15-Sparklines
- 16-Drillthrough Link Breadcrumbs (SSRS)
- 17-Heatmaps
- 18-Spatial Data Visualization
Additional recipes may be added in the future
How to Use this Book
All material contained in the pages of this electronic book are subject to copyright under terms of the Digital Millennium Copyright act. Content is for the benefit of the community and not for commercial gain, promotion or advertising; and cannot be copied or republished without permission from the author. Individual recipe authors are permitted to share their material at their discretion.
Each recipe is a self-contained set of instructions to achieve a specific report type or design pattern. Most recipes use a standard sample database than can be downloaded from this site according to instructions contained in this section. The sample database requires a local or hosted instance of SQL Server or Azure SQL. Recipes are offered “as-is” without any warranty.
The PaginatedReportData sample database can be downloaded along with the recipe resource files here: Paginated Report Book Downloads
Introducing Paginated Report Recipes
Late December back in 2003; what a very special time for me! SQL Server Reporting Services was due to be released to the market and I had been using the pre-released version to integrate reports into a custom web application. After using a variety of products like FoxPro, Access and Crystal Reports, and after mastering essential T-SQL queries and .NET programming, using SSRS was a dream. It was simple and elegant, programmable and powerful. I was so excited that I wanted to tell the world, so I recruited authors to write our first book about Reporting Services. Three editions later, I teamed up with Robert Bruckner, one of the lead developers on the SSRS product team at Microsoft, to write a different kind of book. Robert and I had both blogged quite a lot about report design techniques. Robert had done some crazy things in SSRS that no one knew was possible. He found very creative ways to develop games using SSRS such as tic-tac-toe, hangman and Battleship. Honestly, there are easier ways to do game programming, but he proved that almost anything was possible if you were willing to think outside the box and maybe even draw outside the lines a bit.
Is this the Right Book for You?
Let’s cut right to the chase and answer this important question. Report recipes will help you apply basic report design skills using SQL Server Reporting Services or Power BI Paginated Reports to apply specific reporting scenarios or solve a unique business problem. This book is not an introduction to basic design and you should already have some entry-level skills. If you know how to create a data source, a simple dataset query and basic report data regions (like a table or matrix), you’re good to go. If you have never created a report before, it would be good to get a little experience under your belt first.
Same Report Technology – Different Names
There are three different implementations of paginated reports from Microsoft. Each of these use reports in the same format, defined with an RDL file extension.
How does all this fit together?
Chances are that if you were to ask four people from different IT or business roles to describe the purpose and relationship between Power BI, Paginated Reports and Reporting Services; you would get four different answers. The ironic thing is that they all might all actually be right. The answer really comes down to understanding the history that brought us to where these products are today. You see, reporting tools are used in so many different ways that they evolved out of different product platforms at Microsoft, depicted in Figure 1-1. This means that many have, and continue to have different experiences working with reporting and BI tools from Microsoft.

Figure 1-1 – The Microsoft reporting puzzle
Power BI Paginated Reports and Reporting Services
For our purposes, “Paginated Reports” and “Reporting Services” mean the same thing. That was the simple answer but let’s get a little deeper and I’ll do my best to dispel some potential confusion. You might think that since you only work with either SQL Server Reporting Services, Power BI Report Server or Power BI Paginated Reports that you can just focus on the product that you or your organization have chosen to use and ignore the others. To a certain point, you can. You will most likely not be working with all three product implementations, but you are likely to encounter documentation and references to each and that’s where the confusion lies. Consider that the following terms are all different terms used to describe “operational” style reports created with Report Builder, Paginated Report Builder or the SSDT report designer:
- Paginated report
- Reporting Services report
- SSRS report
- RDL report
Throughout the book, these will be called “Paginated reports”. The design tools for this type of report produce a file with an “RDL” file extension.
Likewise, the following are all terms that might be used to describe “analytic” reports that you create with Power BI Desktop:
- Power BI interactive report
- Power BI report page
- “Dashboard”-style report
- PBIX report
For our purposes, we will refer to these as “Power BI reports”. The design tools for this type of report produce a file with an “PBIX” file extension.
To understand and appreciate why there are three different incarnations of Paginated reports, all with slightly different tool names and versions, you need to know a little about the history that brought us to this point. Since 2004 Microsoft have bundled Reporting Services with the editions of SQL Server that you can install on your own server. Of course, that product is called “SQL Server Reporting Services” (SSRS). After Power BI became a popular way to present highly-visual, interactive reports for analyzing business data; they created a special build of the Reporting Services report server capable of hosting Power BI reports in addition to standard Reporting Services reports on your on-premises report server. That product is called “Power BI Report Server” and aside from hosting Power BI reports, it is nearly identical to SQL Server Report Server. To differentiate between Power BI “interactive” reports, Microsoft began using the term “Paginated Reports” when referring to the more traditional SSRS-type reports. Finally, in 2019, Microsoft integrated Paginated Reports into the cloud-based Power BI service. At the time of this writing, Paginated reports are available to customers with Premium licensing, and may be available with other enhanced licensing options.
SQL Server Reporting Services (SSRS)
If you have been using SQL Server Reporting Services for years, as I have, and you deploy your reports to a Report Server installed within your network domain; the core product has only seen incremental improvements over the past few version. Reporting Services, commonly called SSRS, has pretty much the same feature set since 2010. The Report Portal, previously called the Report Manager, received a facelift and an overhaul.
There are two report development tools for Reporting Services: SQL Server Data Tools (SSDT) for Visual Studio and Report Builder. Examples used in this book will use Report Builder but the same design techniques apply to SSDT. Report Builder is typically installed over the Internet from a link on the downloads menu in the Report Portal. If you work in an environment where you are restricted from downloading and installing software, the latest Report Builder installer can be downloaded from the Microsoft Downloads site. Report Builder is typically updated every few months.
Power BI Report Server
The features of this enhanced edition of the on-premises report server are virtually identical to the SQL Server Reporting Services report server with additional support for Power BI interactive reports. Unlike the Power BI service that is updated very frequently, updates are available for Power BI Report Server and the associated development tools about every four months.
The recommended report design tool for PBRS is Report Builder. Installing or downloading Report Builder from the downloads menu in the Report Portal will ensure that you have a compatible version.

Figure 1-2 – Power BI Report Server Downloads menu
To design and publish Power BI reports for Power B Report Server (PBRS), you will need to use the version of Power BI Desktop that is specifically suited for PBRS rather than the Power BI cloud service. Microsoft manages a special version because the feature sets and release cadence between PBRS and the Power BI service are different. Things can get a little complicated if you also install Power BI Desktop for the service (from the Windows Store of from the Microsoft Downloads site), in which case you will have two versions of the application and you should make it a point to use open the appropriate application version.
Using the Programs menu from the Windows Start button, you will see that the Power BI Desktop version for PBRS has an icon with a black background, gold logo and is titled “Microsoft Power BI Desktop”. The standard version has a gold icon background, black logo and is titled “Power BI Desktop”. Figure 1-3 shows that you can change the default application version associated with files having the .PBIX file extension. In File Explorer, right-click a .PBIX file and then choose Open with from the menu.
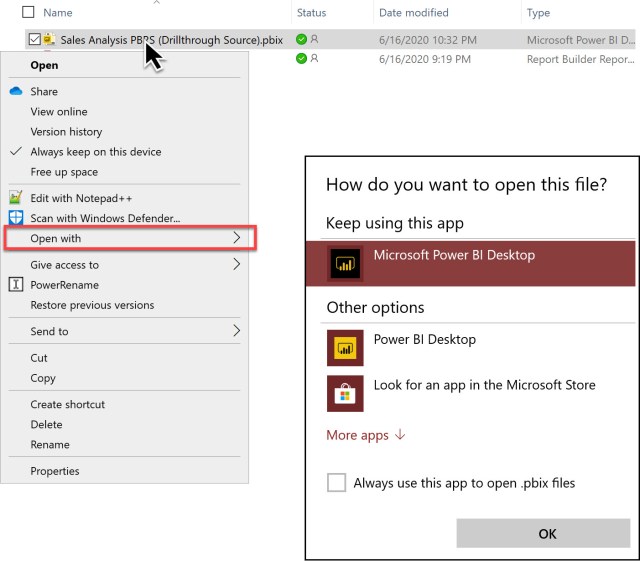
Figure 1-3 – Changing the default application version
Operational Reports and Analytic Reports
We use the tools that we have at our disposal to create the solutions we need. If you were to ask me in 2010 how to design an interactive dashboard to analyze trends, I would have probably done that in SQL Server Reporting Services.
In my previous Reporting Services books, I have dedicated several chapters to techniques for designing interactive, visual, dashboard-style reports for Business Intelligence solutions. Today we think of Power BI as the tool for that kind of analytic reporting. Software and technology is an ever-changing journey and the best solution at one point in time may be quite different just a few years later. That is the reality of the technology-enabled world we live in.
If you need to create a report that allows users to interact with their data in summary, to perform calculations and to present results on a single page using interactive charts and other visuals; Power BI is probably your best bet.
The term “operational report” describes the purpose for reports used for day-to-day business processes. Paginated reports are most often used for operational processes, so the terms are often used together, just like “analytic” and “visual” report are closely related.
If you need to produce a long list of items with groups of details with totals and subtotals, shipping labels, invoices, or a multi-page contract; those are operational reports. Paginated reports may or may not entail multiple pages of content, but they typically consist of multiple fields formatted to fit precisely on one or more pages.
Use the Right Report Tool
Now that we have clarified the difference between these two categories of report types, here’s the complicated part: There can be a lot of overlap between the two and there isn’t always one clear choice. A summary report that allows you to drill-down to transactional details could be both analytical and operational.
Although each reporting tool may be optimal for one type or another, there are a variety of reports that could be created using either Paginated Report Builder or Power BI Desktop.
There is absolutely nothing wrong with creating operational reports with Reporting Services or Pagination Report Builder. Nor is there anything wrong with using Power BI to create certain types of operational reports. The key to effective report design is to work within the strengths and limitations of the design tool and platform, and to recognize when you are at risk of exceeding the boundaries of a reporting tool. Here are a few examples:
A multi-page list of items on an inventory list or shipping manifest, printed and attached to a clipboard to be manually checked-off when delivered – that is an operational report. This same process could be managed without being printed by checking off items on a hand-held table – still an operational report.
Multi-page contract or forms printed on legal size paper?
– operational report
Mailing labels, name badges, place cards for guests at a fancy dinner
– operational report
A collection of charts, tables and other visual report items on a single page that allow you to interactively explore data by filtering and cross-highlighting items by clicking or tapping different visuals
– Power BI in the optimal tool for this style of reporting
A multi-level hierarchy of organization departments and cost centers that where you can expand rows to see more details, with columns representing different costs, forecasts and variances?
– this is though one because both Power BI and Paginated reports have drill-down matrix visuals that allow you to navigate from summary to detail.
A summary and analytical report containing clickable links that navigate to a detail, operational report and filter the results based on items selected in the summary report?
– This is where analytical and operational reports can be used together to create comprehensive, end-to-end solutions.
Setting Up the Book Samples
Two database backups are provided with the book download files. To follow-along and reproduce the recipe solutions, you will need to at least have the PaginatedReportData SQL Server database restored to your on-premises SQL Server instance or an Azure SQL instance in your Microsoft Azure tenant.
SQL Server
Nearly all the recipe instructions in the book include instructions to use the PaginatedReportData database. If you are using SQL Server on premises, you will need SQL Server 2016 or newer. You can install a local instance of SQL Server on Windows 10 using the free Developer license. The download files and instructions are available here: https://www.microsoft.com/en-us/sql-server/sql-server-downloads
Report Server
If you would like to setup a local report server instance, you can use the free Developer license for either Power BI Report Server or SQL Server Reporting Services. Power BI Report Server can be installed from here: https://www.microsoft.com/en-us/download/details.aspx?id=56722.
SQL Server Reporting Services may be installed from here: https://www.microsoft.com/en-us/download/details.aspx?id=100122. Do not install both report server products. If you are not sure which one to use, install Power BI Report Server. Just understand that these products are licensed only for development and not for production use. For production, the license for Power BI Report Server can be considerably more expensive than a conservatively licensed edition of SQL Server Reporting Services.
Make sure you add your Windows account to the Administrators group when installing SQL Server. If you will be working with SQL Server Analysis Services and you want to restore the provided book sample database, choose the option to install SSAS in Tabular storage mode and add your Windows user to the Administrators group during setup.
Note: Unlike earlier versions of SQL Server, Reporting Services is now a separate download and installation. This is because Reporting Services development is now managed by the Power BI product teams and is on a difference release cadence than SQL Server.
SSMS
To manage your SQL Server instance and restore the sample database you will need SQL Server Management Studio (SSMS), which can be downloaded from here: https://docs.microsoft.com/en-us/sql/ssms/download-sql-server-management-studio-ssms?view=sql-server-ver15
Note: The links provided are for the most recent versions of these products at the time of writing and there may be newer versions available in the future, and perhaps by the time you read this. Please research the current product version before using these links.
Install the SQL Server instance completely before installing SSMS and then the report server (either PBIRS or SSRS).
Open SSMS and connect to the local database instance.

Figure 1-4 – SQL Server Management Studio connection dialog
Figure 1-5 shows the two backup files provided with the book download files. Use the following steps to restore the SQL Server sample database.
Copy these files to a folder that is easy to browse to on your local computer storage drive (like C:\Temp). Don’t use your OneDrive or a network folder.

Figure 1-5 – Sample database backup files
In the Object Explorer, expand the relational database instance
Right-click on the Databases node
From the menu, chose Restore Database…

Figure 1-6 – Restore Database option
On the Restore Database dialog, shown in Figure 1-7, click the ellipsis button in the Source group to the right of the Device radio button.

Figure 1-7 – SQL Server Restore Database dialog
A file dialog opens which will allow you to browse to the location of the PaginatedReportData.bak database backup file.
Select the backup file and click OK.
Click OK on the Select backup devices dialog.
Back on the Restore Database dialog, if the same relative drive and folder paths can be created on your computer, the OK button will be enabled and no warnings or errors will be displayed. If a warning is visible, you may need to specify a different path for the database files that is compatible with your system.
Click the OK button to begin restoring the database backup.
Restoring the Analysis Services Tabular database backup is a similar process. After connecting to your SSAS instance, right-click the Databases node and choose Restore…
SSAS database backups can only be restored from trusted system drives. I find it best to copy the backup file to a folder off the root of my C: drive or other local storage drive.
Paginated Report Design Basics
This section will briefly review the essential building blocks of paginated report design that you will use as you apply different report recipes. Since we are not covering all of the beginner-level topics, the purpose of this high-level review is to help you be mindful of the terminology and remind you how these components work together. The following terms were established when the RDL (Report Definition Language) standard was first devised back in 2003. An important fact to keep in mind is that there are only so many words in the English language so many of these terms take on different meanings as they are applied to different products such as paginated reports and Power BI Reports. You want consistent object naming across different products? Nah, that’s just crazy talk!
Note: The best way to truly understand how the various report objects are identified is to open a report definition file in a text editor and review the nested XML elements. You will clearly see object collections and definitions with associated properties.
A thorough understanding of the RDL structure in detail is not necessary to develop a report but understanding the fundamental organization of these objects is important. Figure 1-8 shows a portion of the RDL file for a report alongside the same report in Report Builder. I’ve added arrows to the figure so you can see how these objects appear in the designer.

Figure 1-8 – RDL file and Paginated Report Builder properties
When you choose to create a new report from the File menu in Report Builder, you are presented with the New Report or Dataset dialog shown in Figure 1-9. My preference is to use the Blank Report option. For novice users who need to create very simple “out of the box” reports, one of the first three options can get them started but I am not a fan of the report wizards. Early Reporting Services was architected at a time when it was popular for all “mature” Windows applications to use wizards to step users through a setup or design process. Although SSRS conformed and includes report design wizards, I find it easier and faster to work without them. Just create a blank report and then explicitly add the needed objects. You can drag and drop fields directly into a table, matrix or chart.

Figure 1-9 – New Report or Dataset dialog
Report
This is the highest-level object in the RDL file. Aside from serving as a container for all other objects, properties of the Report object include the printable page size and margins. The following advanced properties are used for adding custom internal or externally referenced programming code, which can be used to extend a report’s capabilities:
Code—Custom Visual Basic functions can be written and stored in the report and then called from expressions on any of the properties for this report. The language is a subset of Visual Basic.NET and shares some characteristics of Visual Basic for Applications (VBA).
References—Like custom functions stored in the Code element, external code libraries may be referenced and also used in property expressions. The advantage of this approach is that a single code library may be used by multiple reports.
Variables—Custom variables may be defined and used within the report to enable dynamic and advanced functionality. These variables are typically set and used within expressions or custom code functions in the report.
Page Properties—Page attributes and properties consist of the page scale units, page orientation, height, width, and margins.
Data Sources
A report has at least one data source object and a single data source may be shared by multiple datasets. A data source contains the connection information needed for a data provider to authenticate and connect to the source of report data.
Data source information can also be stored in a separate shared data source file. If a shared data source is used, the report still has an embedded data source object that references the shared data source object.
When considering best practices, there are two options: embedded and shared data sources. An embedded data source simply includes the connection information within the report RDL file with no external dependencies. If you have multiple reports that share sources of data in a business environment, using a shared data source simplifies deployment and saves time and effort with centralized management. In generally, I consider the use of shared data sources to be a best-practice for enterprise report development. The trade-off is that reports with shared data sources are not as portable. For this reason, all of our report samples use an embedded data source.
Datasets
When you add a query to a report, the designer generates a dataset object which, in addition to the query, defines the collection of fields with associated data types, a collection of parameters, groups, filters and sort expressions. Novice report authors might think of a dataset as the query that returns a set of data. A dataset is often just a simple a bridge between a query that returns a set of data and the data regions and items in the report that consume and visualize the data.
In more advanced scenarios, a dataset has the potential to be a powerful tool that can add sophistication to a report. Consider that a data source like SQL Server can use complex T-SQL queries that support features like parameterized filtering, grouping and sorting. Yet, a less sophisticated data provider like, let’s say a JSON file or an XML data feed, don’t have such capabilities. In this case, parameterized filtering, grouping and sorting can all be performed within the report using properties of the dataset object.
As I mentioned, the dataset contains a collection of parameters. Report parameters used in a query are mapped to corresponding dataset parameters which can then be referenced in the dataset query. The query designer typically generates all the necessary expressions and property settings automatically with little effort for the report author.
Report Body
In the visual designer, the report body is the canvas that you drag and drop items into. The Body object contains just a few properties and serves as a container for all the data ranges and report items within the report. In the designer, the report body really is a blank canvas on which you place report items and data ranges. This is a unique approach when comparing Reporting Services with most other reporting products. This is a very flexible approach to report design that encourages free-form report formatting and unconstrained layout. Rather than being constrained to placing items at specific rows or columns, you have the freedom to place items anywhere within the report body. If you need to repeat items into report body, you use a data region such as a table, matrix or list. The List data region extends this pattern by repeating a free-form region for each record.
Report Items
The most common report item is a textbox because it does so much and is so useful. A textbox can be bound directly to a dataset field to display a single value or it can reside with the cells of a table, matrix or a list data region.
Both of these objects are The difference between a report item and a data region

Figure 1-10 – Report Builder Insert ribbon with Report Items
Data Regions
A data region is a report item that repeats rows, columns or a rectangular region for each grouped value or dataset row. There are three distinct types of data regions: Table, Matrix and List.

Figure 1-11 – Report Builder Insert ribbon with Report Regions
Technically, the all three data region types are implementations of the same core object, called a Tablix, that have certain properties preset to make them behave differently.
A table is a region with repeating rows. Optionally a table can have any number of row groups with corresponding headers and footers for totals and subtotals.
A matrix is a variation of the table with repeating column groups. This effectively creates a pivot table with an aggregated value at the intersecting cell for each row and column group value.
A list is a rectangular region that is repeated for each group or detail row in the dataset. The difference between a list and a table is that any number of embedded report items can be placed in the repeating region.
Filtering Data
Paginated reports have two different mechanisms for filtering data. The most common approach is to use the dataset query (such as the SQL WHERE clause) and filter records at the source.
When the query parser encounters these two query parameters as the query is parsed, corresponding report parameters are added and then these parameters can be fine-tuned in the Report Parameter Properties to provide a better user experience.
Using this filtering technique, if the user provides different parameter values to render several views of the same report within a session, the database will be queried repeatedly, perhaps resulting in longer overall wait times and much of the same data moving across the network multiple times. The dataset filtering feature, which is defined on the Filter page of the Dataset dialog, screens data in the report after it reaches the report server. This means that more data may be retrieved from the database than actually appears in the report. This may not be the most efficient way to filter data for a single report execution, but it can speed things up after the initial query runs and a user continues to interact with a report and provide different parameter values during a session. Because all the data is cached (held in memory), reports will render much faster after the report cache has been loaded. This technique can reduce the overall network traffic and rendering time. The report can also be configured so that the cached data is saved to disk, usually for a specific period of time.
Using Stored Procedures
There are advantages for using stored procedures rather than verbose T-SQL queries in a report. Complex queries can be stored as reusable database objects. Stored procedures can run more efficiently and provide greater security and control. The best way to query a data source will depend mainly on your requirements. Filtering techniques when processing parameters (on the database server, the client, or both) affects performance, efficiency, and the flexibility of your reporting solution. Handling parameters on the database server will almost always be more efficient, whereas processing parameters on the client will give you the flexibility of handling a wider range of records and query options without needing to go back to the database every time you need to render the report. As a general rule, it’s a good idea to filter data on the database server unless you have a good reason to do otherwise.
Using a parameterized stored procedure is typically going to provide the most efficient means for filtering relational data because it returns only the data matching your criteria. Stored procedures are compiled to native processor instructions on the database server. When any kind of query is processed, SQL Server creates an execution plan, which defines the specific instructions that the server uses to retrieve data. In the case of a stored procedure, the execution plan is prepared the first time it is executed, and then it is cached on the database server. In subsequent executions, results will be returned faster since some of the work has already been done.
Using Power BI Datasets in Paginated Reports
One of the fundamental differences between Power BI and Paginated reports is that the best use case for paginated reports is detail-level, operational reporting which typically consume transactional SQL queries. Whereas highly-visual Power BI reports typically provide summary views that are based on a sematic data model (cube or tabular model). One of the many data source types available to Paginated reports published in the Power BI service are Power BI datasets. This a convenient way to consume the same data used in Power BI reports within a paginated report published to the same tenant.
Note: The term “Dataset” has a different meaning in Power BI so don’t confuse this with a paginated report dataset. A Power BI dataset is the published in-memory semantic data model which contains tables, relationships and calculation objects written in DAX such as measures.
The advantage of using a Power BI dataset is that if the summary data needed for your report already exists in a published dataset that may have been created for Power BI interactive reports, you can simply use it without writing another query. A disadvantage might be that Power BI datasets and data models are typically designed for summary reporting and may not be optimal for an operational-style report. If you use parameters or apply filters or sorting in the paginated report, be mindful of the query efficiency and test the performance with a representation selection of data. We have found that in some cases, writing a separate TSQL query may be more performant that consuming a Power BI dataset.
Summary and Dataset Best Practices
When creating and managing datasets, consider the following:
Dataset names cannot contain spaces. Use mixed-case names. Concatenate multiple words and descriptive names, capitalizing the first letter of each word.
Try to avoid changing the name of a dataset after you use it. Data regions have a DatasetName property that must be manually updated if you change a dataset’s name.
Independent report items, like a textbox, may be bound directly to a dataset field. To do this, reference the dataset name in the second argument of the aggregate function used in the Value property to define the function scope. For example, if the CustomerName field is dragged from Dataset1 to the report body, it produces a textbox with the Value expression: =FIRST(Fields!CustomerName.Value, “Dataset1”)
You can use the T-SQL graphical query builder to design simple queries or write them by hand if you prefer. For more advanced queries, design them in the SQL Server Management Studio (SSMS) which has a richer set of code validation and debugging tools. Copy and paste the resulting query into the report designer query editor using text mode.
DAX and MDX queries used in a paginated reports can get complicated to write and to manage. In some cases Power BI may be a more ideal reporting tool for SSAS, AAS or Power BI dataset sources. For paginated report datasets using these data sources, you can use the graphical editor to generate the field metadata, parameters, and parameter drop-list datasets. If you modify or enhance a DAX or MDX query, make sure it conforms to the same metadata signature and the result returns the same fields in the same order. Always make a backup copy of the report before modifying the query.