
When planning a Power BI solution, how can we plan for scale and growth? Like any technology, Power BI has limits but Power BI can manage a surprising large value of analytic data. We also have tools and companion technologies capable of handling workloads of data that alongside Power BI.
The Right Tool for the Job
You wouldn’t use a screwdriver to hammer a nail and you wouldn’t use a chainsaw to assemble an Ikea cabinet; so why would you use Power BI Desktop to create a detailed shipping manifest? It’s not the right tool for the job. The Power BI platform contains tools that are appropriate to use for different reporting scenarios and using them together will yield far better results than forcing tools to behave differently than they were intended.
Power BI is a cloud-based service optimized for analytic, interactive reporting. Power BI really prefers data prepared in a dimensional model. The flexibility of the product lets users and developers to do silly, inefficient things, but not at-scale. Just like I can use a screwdriver to hammer a small nail to hang a picture frame, I wouldn’t advise this method to build a house.
How Much Data Can Power BI Handle?
The Power BI service can handle a lot of data, but just because your data sources are big doesn’t mean that your Power BI datasets will also take up a lot of space. If the data model is designed efficiently, even terabytes of source data will usually translate into megabytes, or a few gigabytes of dataset storage at most. As the industry has largely made the transition from on-prem SQL Server Analysis Services and AAS tabular models to Power BI datasets in Premium capacity, the size limits in the cloud service are notable. The following reference chart from the Microsoft Learning docs shows that a P1 Premium dedicated capacity is limited to 25 GB per dataset. That’s a lot but there are Premium capacity SKUs that can handle up to 400 GB of compressed data in an in-memory data model.
Before you stress about these limitations, the next section clearly demonstrates that datasets this big are rare and typically avoidable through efficient design.

You can find all these details here: Power BI Premium Gen2 Capacity Limits
Another thing to know is that all the power of SQL Server Analysis Services and Azure Analysis Services is behind the Power BI service and in Premium capacity, any dataset can be deployed, managed, and scripted just like an SSAS Tabular database/model. This just in… at the PASS Data Community Summit yesterday (November 18, 2022) a new feature called Query Scale-Out was announced. When released, the service will automatically generate a secondary copy of each dataset and allow you to perform data refresh operations on the secondary behind the scenes without affecting downtime or performance on the published model, no matter how big or small. Just more evidence that Power BI is scalable and robust!

How Much Data Do You Have?
This is always an interesting question because the volume of data at the source rarely coordinates to the amount of memory or storage needed for even a relatively large Tabular model or Power BI dataset. Take a look at this representative example.
If our data warehouse, with many years of transactional history and hundreds of tables across different business subject areas, contains a terabyte of data; we will certainly not need to store a large proportion of that data in the semantic data model. Even for a large semantic model, 30GB would be a lot of data. If you are modeling data correctly in a true star schema, you can expect to see a significant compression ratio of let’s say 10x to 20x. Let’s call it 15x for example’s sake. This means that 30 GB of uncompressed data, primarily in tall and narrow fact tables, might take up 2GB of memory in the production dataset.

A 2 GB dataset is easy to manage in the service using a Premium capacity workspace. With a small number of users, Premium Per User licensing is cost effective with plenty of resource capacity, but how do we get 2 GB PBIX file to the service when Power BI Desktop limits deployments to 1 GB? Simple… you don’t. For portability, if you can keep development files under 100-200 MB, everyone will be happier. I’ll discuss version control, DepOps and CI/CD options for enterprise Power BI projects in the later parts of the blog series.
Data Scaling Options
How much extra work is it to prepare for scale? This depends upon your needs and how much data you need to manage. The good news is that if you are mindful to apply good patterns of design, you can move from moderate to large scale without starting over. This is what best practice design is all about… a little preparation.
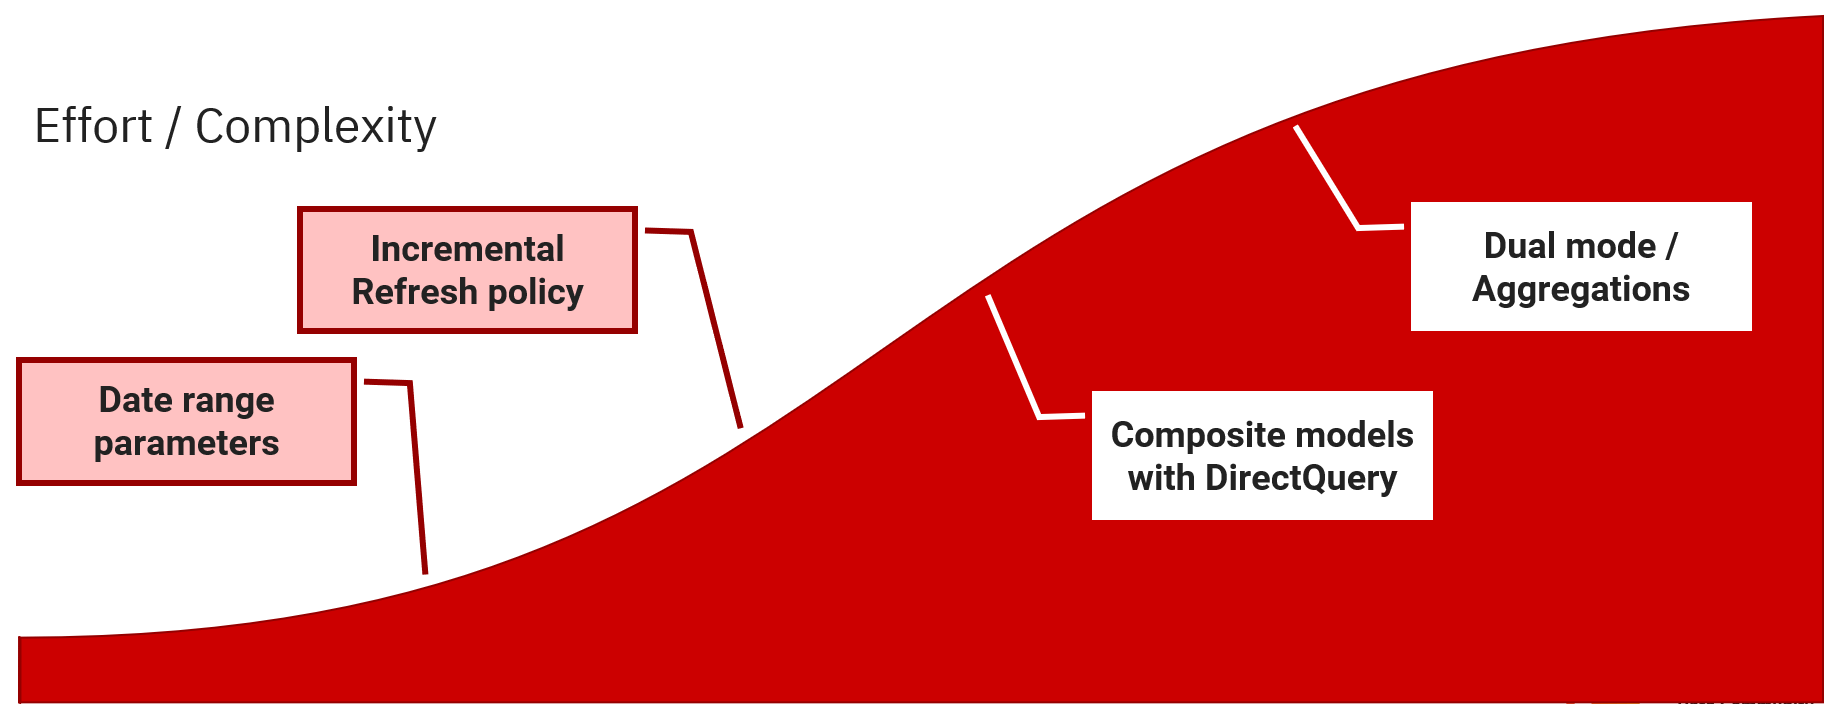
For now, start with building all of your Power Query queries with a set of date range parameters. The figure below shows the graduation of steps and techniques to apply in the journey from small or moderate size enterprise Power BI projects, up to serious, large-scale solutions. If you apply consistent best-practice design, you don’t need to worry about applying the perfect design pattern for the specific scale needs of your project. Just follows good rules of design and your solutions will be future proof.
Date Rage Parameters
Here is the design pattern… I recommend this approach because it is an easy way to manage the volume of records in a table AND will enable you to turn on Incremental Refresh later if you need to partition large fact tables. If you don’t, that’s fine but you’ll always have the option. I mentioned this about two years ago in this post titled Doing Power BI the Right Way: 2. Preparing, shaping & transforming source data
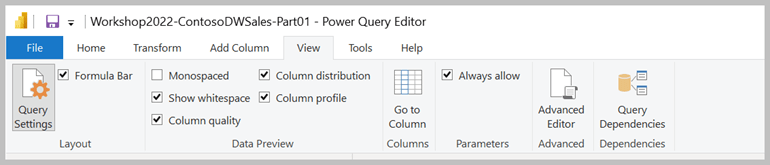
The first step is to allow parameterization in Power Query. This can be done in the Options and Setting dialog, accessed from the File menu; or here on the View ribbon in the Power Query Editor. Just check “Always allow” parameters:
In a fact table where you have a date type column to use for partitioning or filtering, either create a duplicate column or convert that column to a date/time data type. Create a pair of date/time parameters named RangeStart and RangeEnd.
Then, add a date range filter to the date/time column using the parameters, like this:

Set the parameter values to a narrow date range and refresh the data model in Power BI Desktop. This keeps the file size small and doesn’t take long to load records into the table.
Preparing for CI/CD & Team Collaboration
After deploying the dataset to the service, you just change the parameter values and refresh the dataset. Like magic, you will have a fully loaded dataset in the service for reporting and a small file on your desktop that supports version control and development. Keep these small PBIX files in a shared OneDrive synched folder, or if you are working in a formal IT project, check your files into a GitHub repository. Either option allows you to track and manage version control and to share files with other members of your development team.

Again, you don’t have to use the Incremental Refresh feature, but this article shows the requirements in detail: Incremental refresh for datasets and real-time data in Power BI – Power BI | Microsoft Learn
Just today, Chris Webb shared this blog post about how much data you can load into Power BI, and talks about how to work within the limitations of Pro licensing: Chris Webb’s BI Blog: How Much Data Can You Load Into Power BI? Chris Webb’s BI Blog (crossjoin.co.uk)

Hi Paul,
Great article. I understand how this practice is useful when using Power BI desktop on a developer’s machine, but how do you manage this when it comes to deploying to production and moving through environments?
For example, a developer has to add a new column to a fact table, they have taken the .pbix file from source control and changed the dataset parameters to point to DEV, locally on PBI Desktop, and added the new column. If they have a date range applied it will just bring in data for that range, otherwise the entire source data. They now need to move to test and follow the same pattern.
If we were to follow the same pattern when deploying to production – there will be a period of the production data model being incorrect – essentially the time between publishing to the service & refreshing the model in the service (after changing the date params). How do you handle that? Unless you refresh the entire model locally.
And a second question, if we are using incremental refresh – we can no longer use pbix as this will just wipe the partitions when deploying to the service and now have to use the XMLA endpoint, how do you handle moving between environments, in particular production in this scenario? For example, If I add the new column to the fact in production via XMLA – when I then refresh this entire fact as I need to pull in the historical values for the new column – are users still able to query the model? If not, do you recommend comms with the business etc to say, ‘there’s a change window and please don’t the use the model at this time etc?’ Previously in Analysis services, we would have a processing server and a sync server, so in effect no downtime.
I hope that makes sense.
Regards
Will