Part of the the series: Doing Power BI the Right Way (link)
Although my professional focus is building enterprise-scale BI solutions, I’ve created my share of informal Power BI reports that were put together quickly, with the goal to create something “good enough” rather then achieving perfection. This guide is about designing proper and formal solutions but these practices apply to any Power BI project that needs to survive future maintenance.
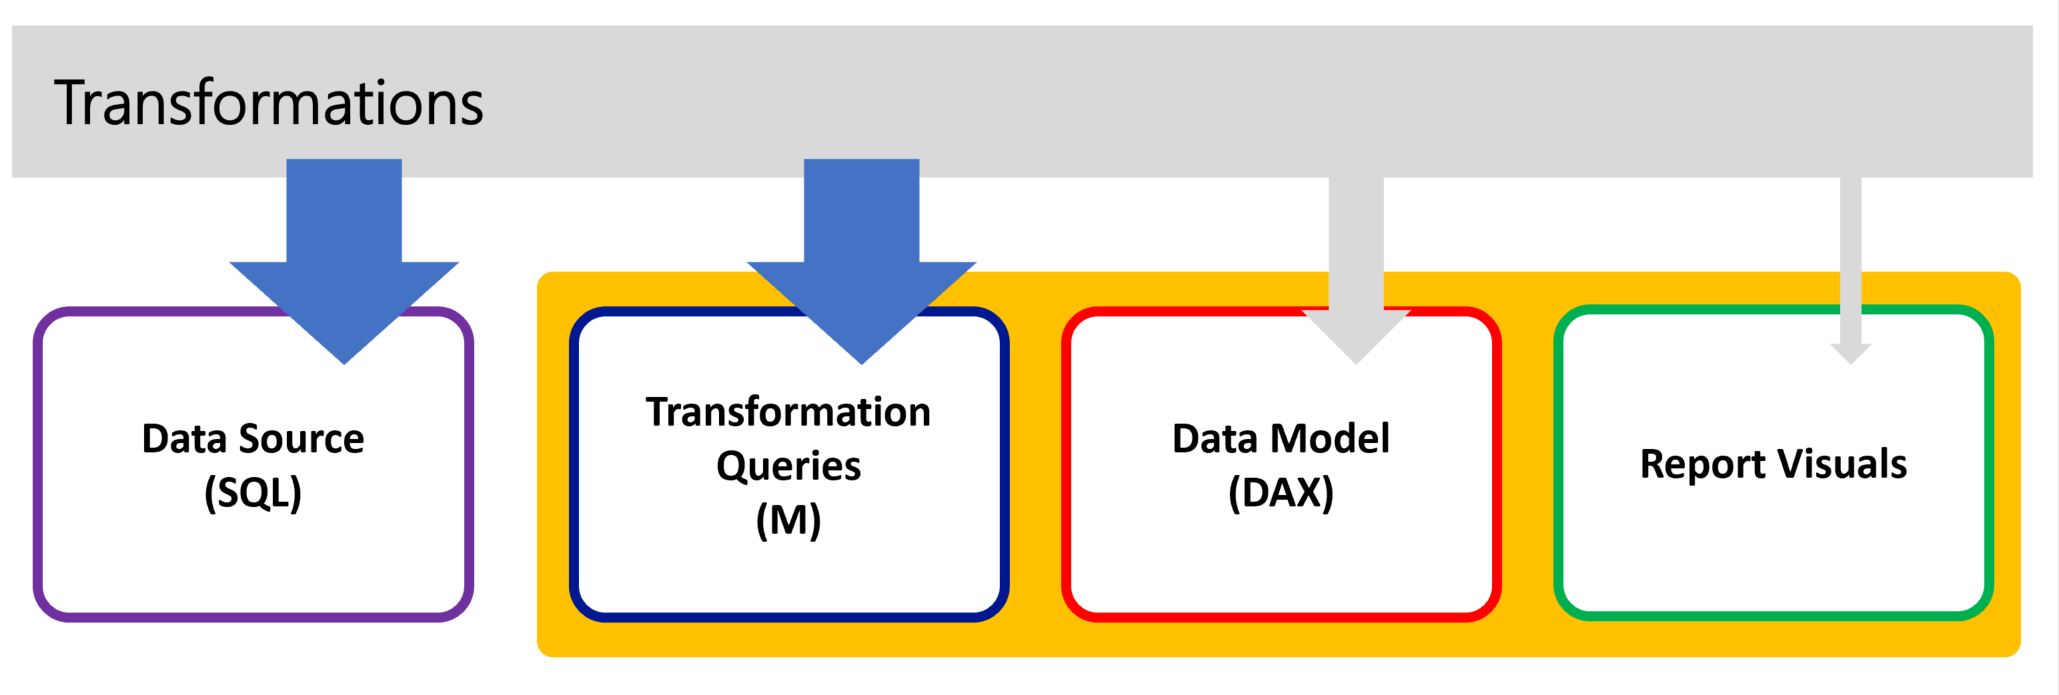
When you need to load data into a data model, you have a few options and the right choice is going to depend on a few factors. This equation is usually a balance between quickly and conveniently generating a table or using a disciplined approach to get reliable data from a sustainable source of record. The following image shows that data can be transformed in the source (or before data is loaded into the source) or within Power Query using Power BI Desktop.
Convenience or Scale?
Life is full of choices and trade-off decisions. Let’s say that you need to create a lookup table containing sales regions and this information doesn’t exist in the source database. You could easily create a new table in Power Query using the “Enter Data” feature, and just manually enter the sales regions. This would solve the immediate problem with very little effort, but how will the table be maintained if sales regions are added or change in the future? We could keep the list of values in an Excel file stored in SharePoint for a business owner to maintain when information changes. You could also go all the back back to the beginning of the process and load a dimension table in the source database. IT professionals might take the hardline and say that all data must flow through the data warehouse regardless of the effort and cost. Which of these is the right choice? …it depends on the scope reporting project, and the long-term ownership of the solution. Sometimes quick and convenient are OK but particularly tables that need to scale and handle larger data volumes in the future, the following guidelines are critical.
I’ll get to the point and then explore the details afterward. Start with these fundamentals:
- A proper data model is the heart of a Power BI report solution.
- The purpose of Power Query is to shape and prepare each of the tables loaded into the data model.
- The tables, fields and measures in the data model should be uncomplicated and user-friendly; intuitive and easy to navigate.
Recommended Practices
Following are the general best-practices I religiously apply when creating queries. After briefly describing each recommended practice, I’ll break it down and review some in detail.

| Practice | Explanation |
|---|---|
| Use parameters for query paths & connections | Parameters are used to make the solution portable. Any connection information, like a file path or database server name, should be stored in a parameter so it can be changed without modifying query code. |
| For large SQL tables, reference either tables or views | Power Query has optimizations built-in to work with different data connectors. Several connectors support query folding, where Power Query translates query steps into the native query language. Starting with a SQL query rather than selecting a table or view from the list of database objects will ensure that query folding will not work. When possible, start with a table and if you need to use SQL to prepare data before loading it with Power Query, create a view. |
| Limit large table volume using data range parameters, compatible with Incremental Refresh | Incremental Refresh enables the Power BI service to partition large tables and only load data that changes rather then the entire table when the dataset is refreshed. This was once a Premium-only feature that now works with shared capacity licensing with datasets up to 1GB in size. Even if you don’t intend to use the Incremental Refresh feature, using a pair of date range parameters allows you to filter large tables and keep the PBIX file size small. After publishing the file to the service, you can update the parameters and load more records. Create two date/time type parameters named RangeStart and RangeEnd, and then add a date range filter according to these instructions. |
| Remove all unneeded columns | Resist the urge to leave columns that you are not sure that you need for reporting. In each query, remove all unneeded columns early in the sequence applied steps. The easiest way to do this is to use the Choose Columns button on the Home ribbon and deselect columns. To change the selection later, click the gear icon next to the Remove Other Columns step. |
| Rename using title case for all table names and column names that will be visible in the data model | Although it may seem trivial, it is absolutely necessary to apply friendly naming conventions to all tables and fields. Chris Webb wrote an excellent post and about object naming conventions. As a rule, rename all columns that will not be hidden in the data model, using friendly title names (with spaces and mixed case). There is no need to rename primary key, foreign key and other utility fields. After tables are added tot he data model, hide those fields to remove clutter and confusion for report developers (even if you are the report developer). |
| Explicitly set data type for all columns | Column renaming and changing the data types an be time-consuming work but be meticulous about check every column returned by the query. |
| Consolidate multiple steps of the same type (such as change type and rename columns) | As query design evolves, you will inevitably create inefficient queries with redundant steps. There will always be opportunities to improve the design, often by consolidating and reorganizing steps. |
| Rename key steps to document purpose and aid future development | Renaming query steps allows you to understand the function and purpose of each step in the Applied Steps list. This creates a self-documented series of operations that will be easier to maintain down the road. |
| Add code comments in the M script and/or step descriptions to document queries | You can further document query steps by changing the step Description in the Properties window or by adding code comments in the Advanced Query Editor. |
| Use steps that promote query folding | Many query steps allow records to flow-through without blocking subsequent steps. There are also certain transformation steps that must read all the records into memory to apply the transformation. |
| Move steps that break query folding as late as possible | Steps that support query folder, that can be translated into the native query language of the data provider, should be performed first. If non-foldable steps can’t be avoided, they should be performed as late as possible in the sequence of query steps. |
| Perform Pivot, Unpivot, Transpose transformations only on small result sets | These transformations must load all records into memory. They are powerful but have volume and performance limitations. Test them with production-scale source data. |
| Create row-level calculations in Power Query instead of DAX | Row-level calculations and derived column values can be performed either using Power Query or DAX, but M s a far more capable language for data transformation. Effective data preparation using Power Query will simplify and ease the burden of data model design. Regardless of the relative efficiency, if you perform all data preparation and transformation in one place, this can simplify maintenance in the future. There are less-common cases where DAX is the best choice to create calculated tables and calculated columns outside the scope of a single row. |
| Avoid using DirectQuery when not warranted by latency and data volume requirements | DirectQuery has it’s place in data model design but it should be an exception to the normal pattern of importing data into an in-memory data model. DirectQuery tables can work with simple aggregation calculations but don’t perform well using many other DAX functions. Use DirectQuery to aggregate values over very large tables that won’t otherwise fit into memory, or to support drill-through into non-aggregated detail records. These are advanced design patters that should be treated as rare and exceptional. |
| Avoid using native SQL queries, especially with large source tables | Native SQL queries don’t support query folding so they should be avoided when possible. This may be a an acceptable exception to load low-volume query results but generally use a database table or view for query data sources. |
| Use Date/Time values for dates (use Date or Time) | Load column data only at the necessary level of grain so values in the data model will compress. In particular, reduce date/time values to date only. For time-level resolution, store date and time values in separate columns. |
| Import or create Date/Time tables in Power Query rather than using auto-generated date hierarchies | Auto-generated calendar tables in Power BI Desktop are fine for self-service projects but purposely-built date tables will afford more flexibility. If available, use a date dimension table in your data warehouse or source database. Secondarily, generate a date table using Power Query. Date tables can effectively be created with DAX functions but if all tables are loaded with Power Query this gives you the convenience of managing all tables centrally. |
Breaking It Down
Let’s take a deeper look at some of these recommendations.
Use parameters for query paths & connections
For every file path, web address or server name in source connections; use a parameter. It is not hard to go back and edit source connection information using the Advanced Editor but the easiest way to build parameterized connections is to build them as you go.
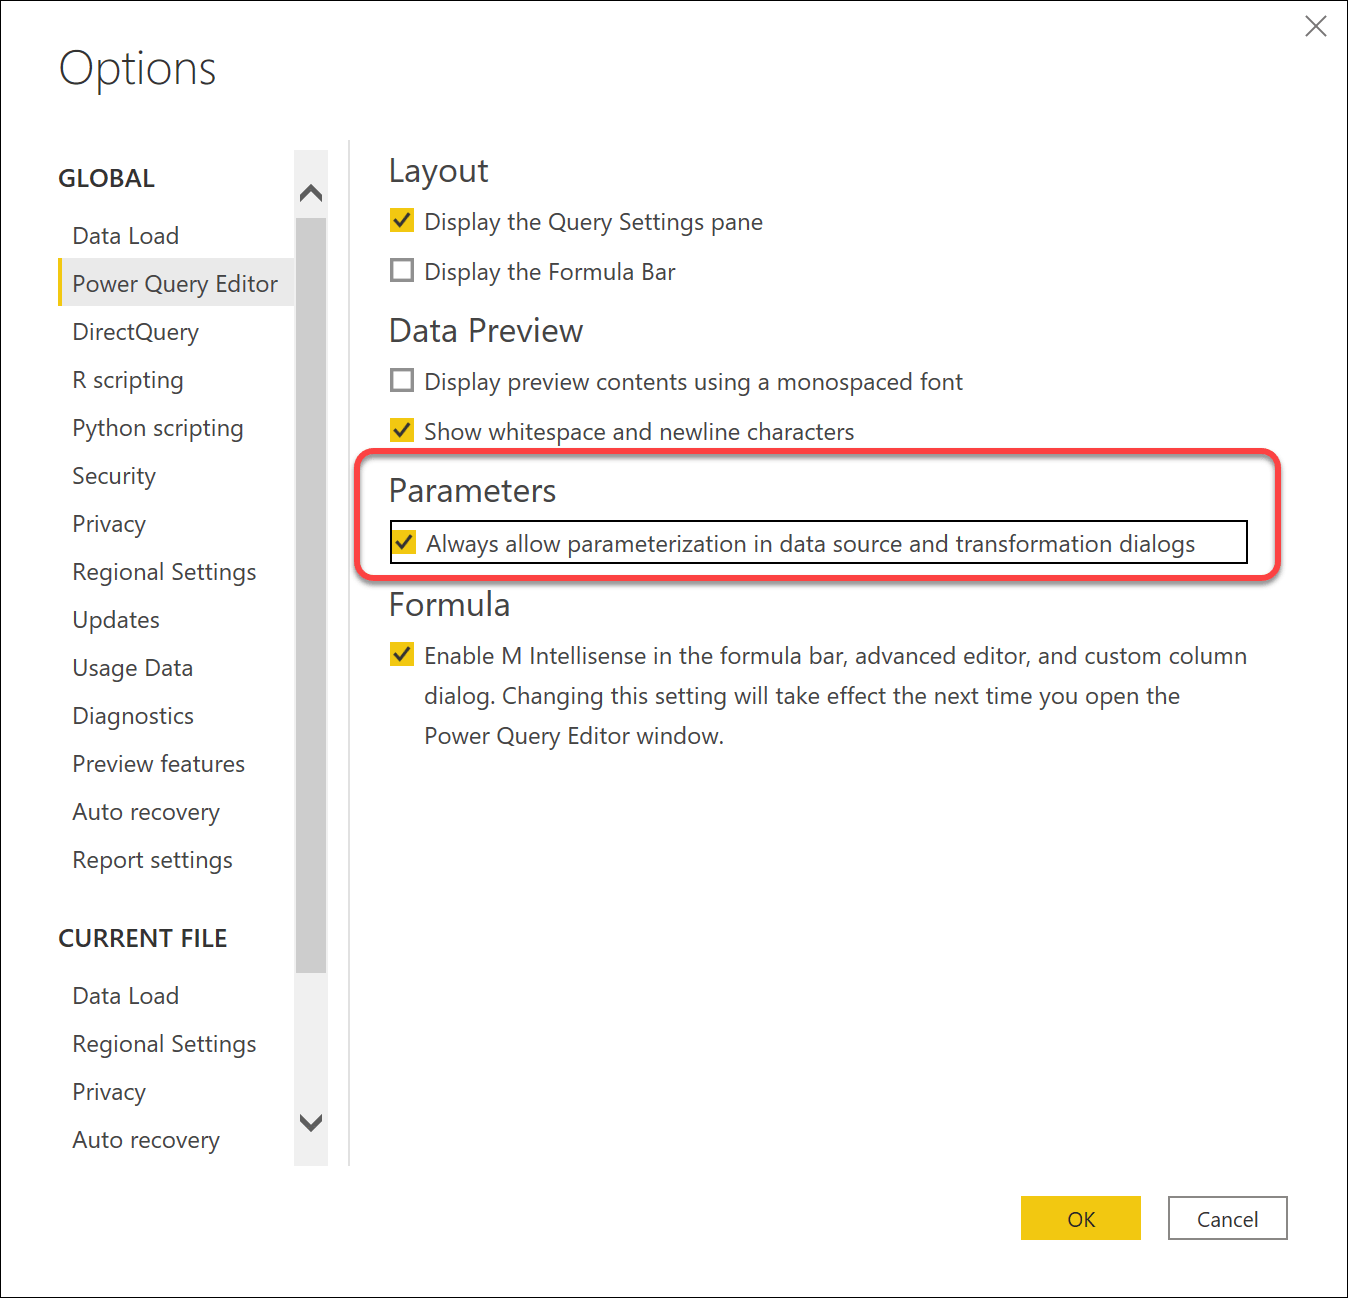
Start by enabling the feature “Always allow parametrization in data source and transformation dialogs” on the Power Query Editor page in the Option dialog.
As you build each query connection, for most connection types, you will be promoted to select or create a new parameter.

Here is an example of the parameters in a demonstration project. Without modifying any code or editing a query, any of these values can be changed easily.

Here are two examples of parameterized connections. For the SQL Server connection, the server/instance name is passed as the first argument to the Sql.Database function. The second example concatenates the folder path (stored in the SourceFolderPath parameter) with the file name to create the fill folder and file path.

For large SQL tables, reference either tables or views
The best way to guarantee poor query performance with a relational data source is to start with a hand-written native query (like SQL) and then perform transformations on the results.
If a query is based on a relational table or view, Power Query can generate the native SQL (and a few other supported languages) with a SQL statement rather than selecting a table or view.
Use Query Diagnostics to Diagnose and Performance Tune
The following image shows the results of Power Query Diagnostics which I describe here: Power BI Query Performance & Query Diagnostics | Paul Turley’s SQL Server BI Blog. This post demonstrates how to capture timings for each step and overall queries.


Hi,
Thanks for the great info. I was partially doing these steps – but will definitely help to optimize!
I am looking to get your thoughts as to when it is best to split facts from dimensions. It is better to do it early in the process (before step 7) or at the end, before loading it to a model?
I assume that there may be performance improvements when completing the transformations if it is done earlier, however, would it be material enough to offset the potential drawbacks such as loosing some context (as being replaced by keys) to perform some custom calculations or potentially performing the dimension/fact split on multiple tables instead of just once (assuming those tables are all appended together at the end)?
Good Post, Legacy Modernization Services
Every business can benefit from a tool that enables them to transform data into insights and insights into real business value. Being one of the leading BI tools, Power BI is a powerful reporting tool, dominating the market and rapidly emerging. Thanks for sharing your thoughts and the general best-practices that you use. Quite helpful.
It is a wonderful reply to the question that has been asked since a longer time.Given answers were so immaculate that will open many eyes.
Hi Paul,
I tried something similar to your first recommendation by making a list of my Excel files which are my data sources in another Excel file. I then wanted to use that in another query to aggregated the data from the files listed. But then the firewall came and said “You are using in your queries results from another query”.
So my even more user-friendly approach to maintaining the sources, namely having the source listed in a place where the user could update it also without touching the query.was failing.
But the parameters is the only possibility here, meaning for updating I would still need to go into PowerBI and modify them if my sources change, right?
Really insightful. You really helped me cement the little I know and I am learning so much more with every update. Thank you kindly
Really enjoying this series Paul. Great advice for someone. like me who knows enough to get by, but benefits hugely from your best practice and tried and tested workflow. Thanks for sharing!
Great tips. Thanks for sharing 👏👏👏