Part of the the series: Doing Power BI the Right Way (link)
Data Modeling 101: part 1 (more advanced techniques in part 2)
A data model is the foundation of analytic reporting. It provides structure and order over information that might otherwise be chaotic and untrustworthy. Loading data into a properly designed model ensures that it conforms to some essential rules that provide better performance, reliability and accuracy.
Different Schemas for Different Needs
One of the most important lessons I have learned about data modeling over the past 20+ years is that there isn’t one model that fits all business needs. However, there are simple patterns we can follow to model data according to different business needs. Each pattern or schema has a different set of rules. At a very high level, we can think of these schemas in three different categories.

When reporting requirements are simple and unsophisticated, sometimes the easiest way to model a set of data is to transform it into a single, flat table. There are several trade-offs and limitations when using this approach, though. This is typically the goal when bringing information into a spreadsheet so you can simply add-up a column of values, perhaps filtered by other columns. It might seem natural to use the same approach when making the transition from Excel to Power BI. Here is an example of retail order data organized into a flat table:

Look over this sheet before moving to the next figure. If this data were stored in an Excel sheet, how could we use it for reporting? You could filter by the Order Date column and add up the Quantity, Unit Cost and Unit Price. You could also apply filters to the Company Name, Category, Subcategory or Product Name columns. For simple reporting, this could meet our needs.
The master/detail pattern is typically used with transactional data. Master records, like orders or invoice headers, are related to detail records such as the order details or invoice line items. The master/detail pattern can be repeated with multiple tables to create a normalized database. Use this pattern sparingly to support drill-to-detail reports. Including unnecessary detail in an analytic data model uses a lot of memory and storage, and can impact report performance.
When relational database professionals are introduced to Power BI, they will often see DirectQuery as a simple means to leverage their familiar and existing relational database or data warehouse, only to be disappointed by poor performance and other limitations. However, master/detail schemas are where DirectQuery can provide a best of both worlds solution so long as the analytic needs over detail data is light. If we need to provide the ability to drill-down to detail records from an interactive report without needing to perform calculations over the entire detail record set and avoid sucking billions of records into memory, DirectQuery might be the ticket.
Dimensional Modeling 101
The rules of dimensional modeling are a lot like the laws of physics in that the rules of dimensional modeling were really discovered rather than invented. By applying dimensional design patterns, data will naturally behave and reports will perform well. Dimensional rules really help describe the way data behaves when stored in the most optimal form for reporting and analysis.
The Kimball Group are credited as the pioneers of dimensional modeling and although the books and papers that Ralph Kimball and his colleagues authored are 20-30 years old, they are as relevant today as ever. I’ll cover some of the basics but you can find a comprehensive reference guide to dimensional modeling patterns and techniques on the Kimball Group site here: Dimensional Modeling Techniques – Kimball Group. There have a been a few recent publications employing modern examples in books such as Star Schema – The Complete Reference and Agile Data Warehouse Design. Both are excellent books but unless you are undertaking a huge data warehouse project with complicated data problems, understanding the essential concepts is sufficient.
By organizing information into fact and dimension tables, we store as little data as possible while maintaining consistency and data integrity. In data design, we often refer to “entities” and “attributes”. An entity is something we keep track of (like a Customer or Product). Entities have attributes which describe specific properties. In the analytic data world, entities are usually materialized as dimension tables and each attribute is a column or field.
A fact table contains the numeric columns used to summarize and aggregate measure values, along with the key columns that are related to the dimension tables. Dimensions contain the attributes used to group and filter the business facts. Fact records share the same level of grain across all dimensions. For example, if domestic sales orders and international sales orders each have the same level of detail for dimensions like Customers, Products and Order Date, these records could be stored in the same fact table. But, if Sales Targets are applied at the month level rather than the date, they must be stored in a separate fact table.
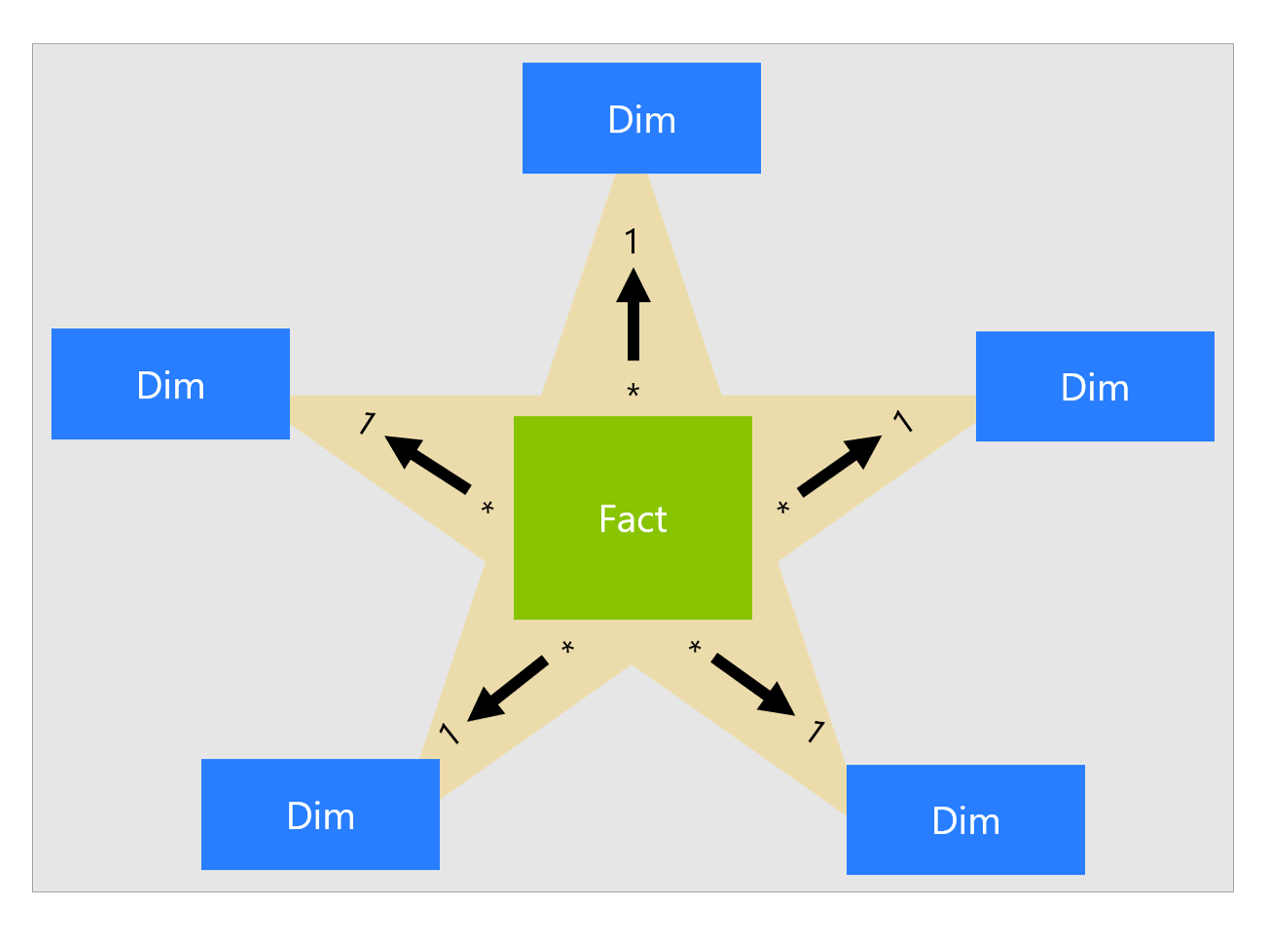
The essence of a dimensional model is the star schema, simplified here to show one fact table related to a small number of dimensions.
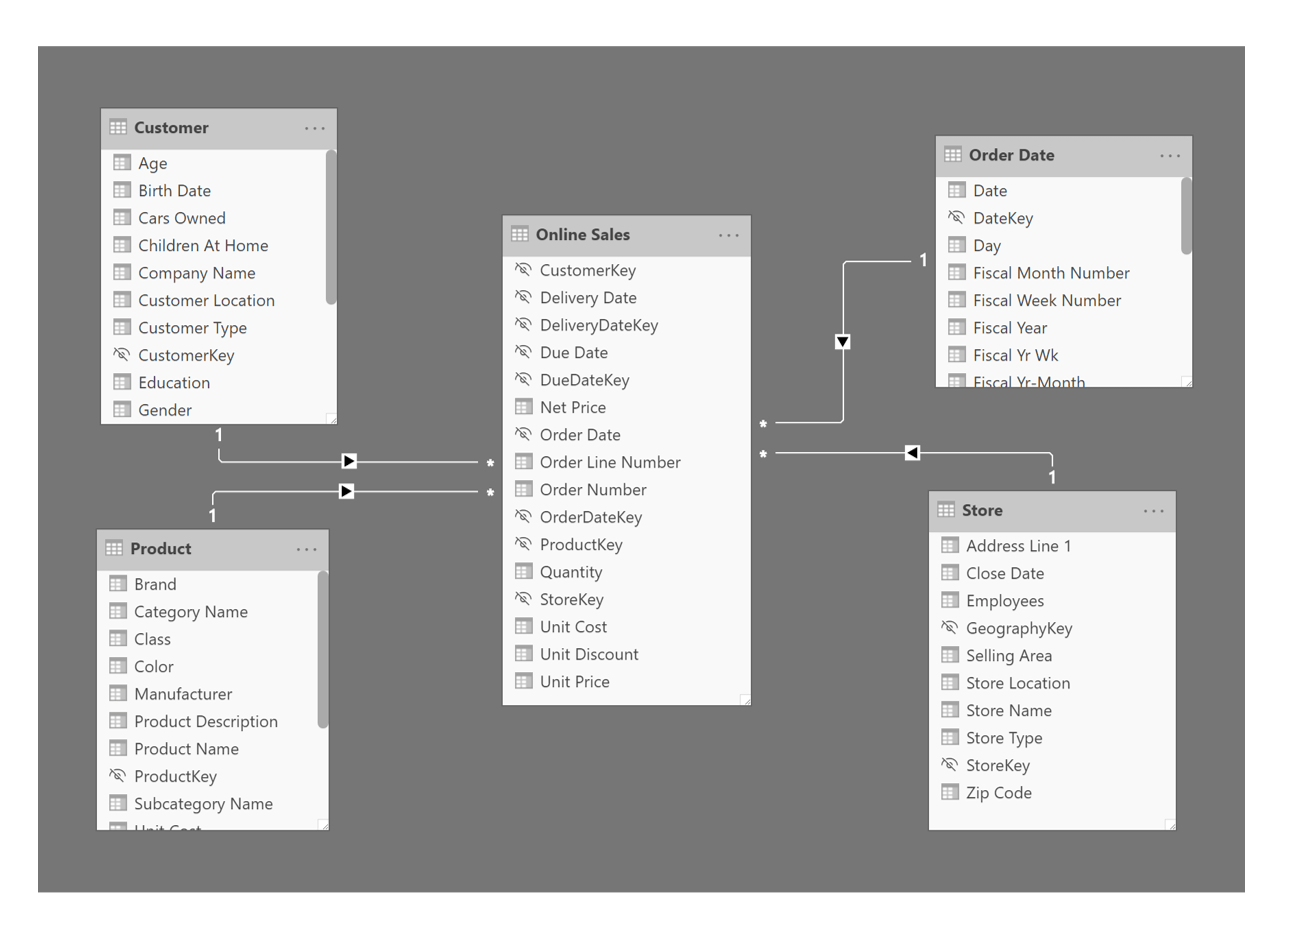
A real application of the star schema design is shown in the following image. The Online Sales fact table contains key columns that are used to relate this table to each of the dimensions. The fact table also contains numeric type columns used to define measures which aggregate and total numeric values such as Net Price, Quantity, Unit Cost, Unit Discount and Unit Price. You’ll notice that the relationship from each of the dimension tables to the fact table is one-to-many and filters records in one direction, depicted by the arrow on the relationship line. For example, the relationship from the Customer table to Online Sales is based on the CustomerKey column in both tables. The relationship filter direction indicates that if the Customer table were filtered on a report, Online Sales would be filtered accordingly. However, if the Online Sales table were filtered in a report, this would not cause the Customer table to be filtered.
According to the Kimball Method, there are four stages to define fact and dimension tables:
- Select the business process
- Declare the grain
- Identify the dimensions
- Identify the facts
Seems pretty simple, right? It can be at a macro level until you need to get into the weeds. The trick is to maintain a high-level business perspective as you work through the the details to solve data problems. I find this to be a useful whiteboard exercise when starting a new project. Using only business tools and business language, diagram data entities at a high level using this approach. Next, break the process down using these steps:
- Load detailed atomic data into dimensional structures
- Structure dimensional models around business processes
- Ensure that every fact table has an associated Date dimension table
- Ensure that all facts in a single fact table are at the same grain or level of detail
- Resolve many-to-many relationships in fact tables
- Resolve many-to-one relationships in dimension tables
- Store report labels and filter domain values in dimension tables
- Make certain that dimension tables use a surrogate key
- Create conformed dimensions to integrate data across the enterprise
- Continuously balance requirements and realities to deliver a DW/BI solution that’s accepted by
- business users and that supports their decision-making
Something to keep in mind is that these rules and steps apply equally to formal, IT-based model design and to self-service BI projects. However, the tools have been modernized over the past decade or so; along with the degree of strict adherence to the rules. Simply put, in the new age of self-service BI, everything is negotiable. But something else to keep in mind is that bending or breaking the rules nearly always comes at a cost. For example, step 8 prescribes creating surrogate keys to identify dimension records. You can use the original business keys throughout the model but run the risk of encountering key collisions or other data quality issues.
In some cases, the lines that separate facts and dimensions can become blurred, which may need to be considered in your model design. For example, I recently developed a BI solution where we counted employee hiring events and a row in the Hires fact table was simply a record of the event when an employee was hired along with information like the hiring date and position. There were no numeric columns to sum-up so we simply needed to count these records. This is often referred to as a “factless fact”. Another exception to the typical star pattern are cases where a fact table contains a value we could use for grouping or filtering, and it might be pointless to extract it into a separate dimension table. This is known as a “degenerate dimension”. These are examples of cases where you could arguably apply the dimensional design rules strictly out of principle or err on the side of simplicity. The right answer for each case should be driven by the business reporting requirements while considering the the reliability and matainability of the overall solution.
Let’s apply the process to the flat table of sales orders. Here it is again with some of the dimensions and facts identified:

In this example, there are three separate date columns that record the date an order was placed, the date it was due and the date that the order was delivered. Customer information includes the Company Name and a unique CustomerKey which could be used to lookup detailed customer information. There are three numeric columns that can be summarized or aggregated. These columns could also be used to perform more complex calculations like ratios, running totals and time-series comparisons.
Dimensional Concepts
Now, let’s review some common practical dimensional modeling applications.
Role Playing Dimensions

Dimensional entities can play more than one role in reporting. In the flat table, the three date columns have completely different purposes but all store the same type of value; a date. But dates can be used to group and aggregate data in date part groups like month, quarter, year or fiscal periods. They can be used to perform time-series calculations like month-to-date or same period in the previous year. To do this, you absolutely must have a date dimension* table containing a contiguous set of date records over a period of time. For our purposes, we might need all dates for the past five years through the end of the current year. Date dimensions are the most common example of role-playing dimension but let’s look at another scenario before looking at at more date examples.
*Power BI Desktop includes features that will automatically generate a date dimension table, and there are DAX functions you can use to generate date tables in code. Although useful in certain cases, I prefer to manage date tables the old fashion way so I have one constant method for importing and managing all tables. By comparison to other data challenges, building date dimension tables is a relatively simple task.
The following image shows a fact table named Flights, with two role-playing Airport dimensions. An airport is, well it’s just an airport… it has a three-letter code and some information about the geographical location. But with respect to any given flight, an airport can serve two functions: to depart from or to arrive to. In this example, it is necessary to materialize the Airport table twice: the Departure Airport and the Arrival Airport.
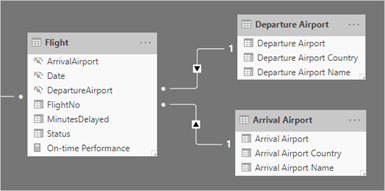
With two role-playing Airport dimensions, a report user could ask for all the flights from Japan to Australia on a given date.
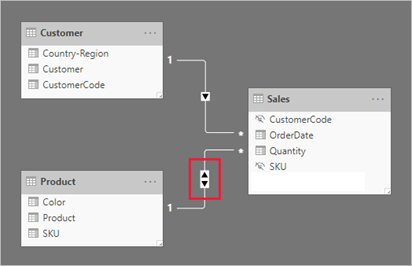
Back to the retail sales example, let’s say that our Sales fact table has two date keys; OrderDate and ShipDate. A single Date dimension can only have one active relationship. The following image shows the result of the autodetected relationships between Sales and Date, where one of the relationships is inactive and effectively useless for most practical purposes.

This image shows three separate instances of the Date dimension table imported using referenced queries in Power Query. The three tables: Order Date, Due Date and Delivery Date use up a tiny bit more memory than a single instance of the table but give report users more flexibility to answer business questions.

A Table for Every Date Column?
An attendee in a data modeling session recently asked this question. She said: “I have 14 date columns in my fact table used to track a variety of different events. Do I need to create 14 different Date dimensions?” My answer was “certainly not.” This is an extreme example but a very good question. You only need separate date dimension tables when you need to have the flexibility to use time-series functions in DAX or to perform comparisons using date part fields (like Year, Quarter or Month). Operations like calculating the difference between two date type columns or counting rows with future dates can be performed using fields in the fact table. I’ll show you an example in part 2 of this blog series. This is one of those “it depends” situations where you must make a judgement call depending on your business reporting requirements, balancing simplicity and maintainability with complexity and flexibility.
Many-to-Many relationships and Bi-directional Filters
File this under “don’t do this unless you have to.” Many data modeling decisions are a trade-off between performance and functionality; and using iterative design, you will often find a better way to solve problems as you go. There are a few different ways to design for many-to-many relationships. The conventional approach is to use a bridging table that contains all of the combinations of keys that relate two tables together. In the following example, the Customer and Product dimension tables normally would have a single-direction filter from the “one-side” to the “many-side” of the relationship. If reporting requirements call for filtering products based on selected customers who purchased them, we can use the Sales fact table as a bridge table and change the relationship between Product and Sales to use a bi-directional filter.
Depending on the cardinality of the relationship, using a bi-directional filter could introduce a performance penalty. If we only have 100 products and less than a million Sales records, this is probably not a big deal. If we have 10,000 products and 100 million Sales records, this relationship will likely slow things down considerably.
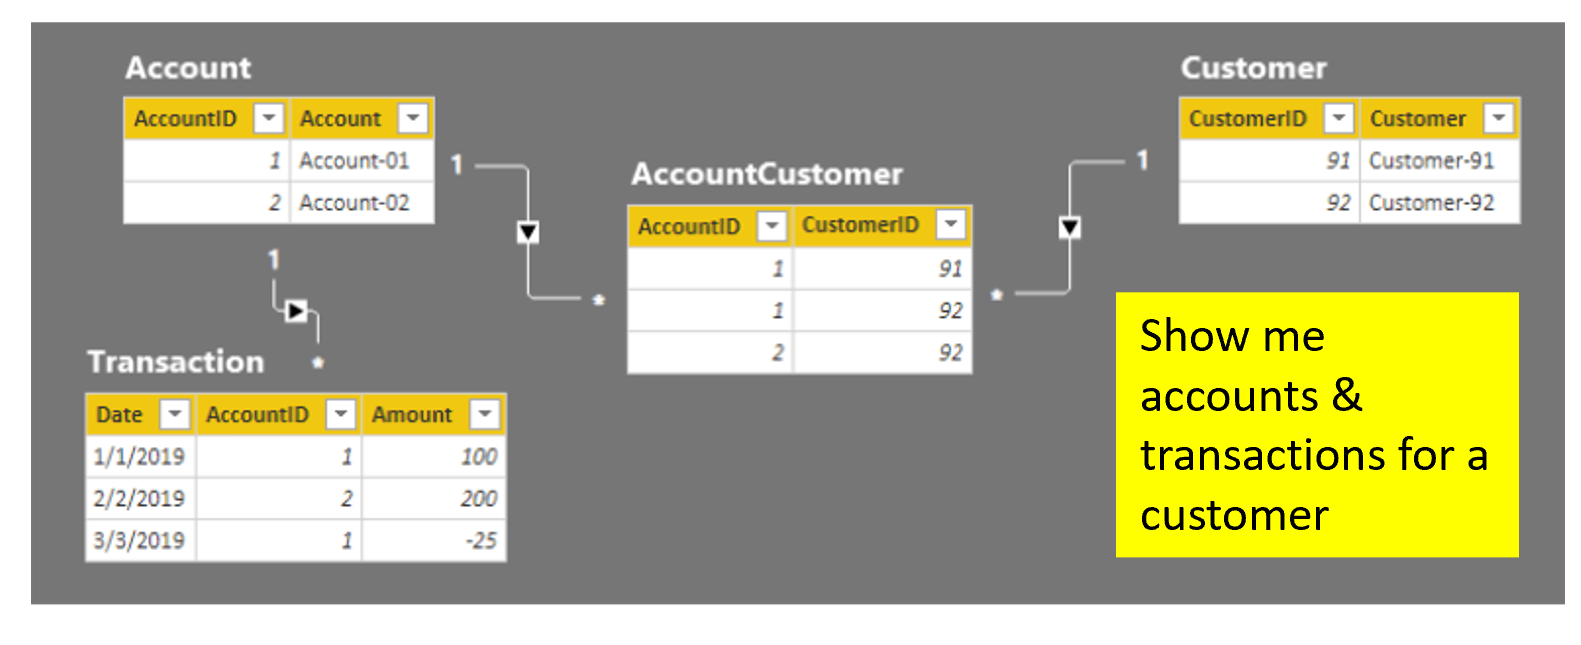
Here is another example: Given the requirement to show accounts and transactions for a selected customer, the following model doesn’t work with out-of-the-box relationships. To understand why, follow the flow of filtered records through the relationships. From Customer to AccountCustomer, the arrow on the relationship line indicates that the filter flows in the right direction. Once the AccountCustomer table has been filtered, the Account table will not be filtered as we try to swim upstream because that relationships doesn’t naturally flow from the many-side to the one-side.
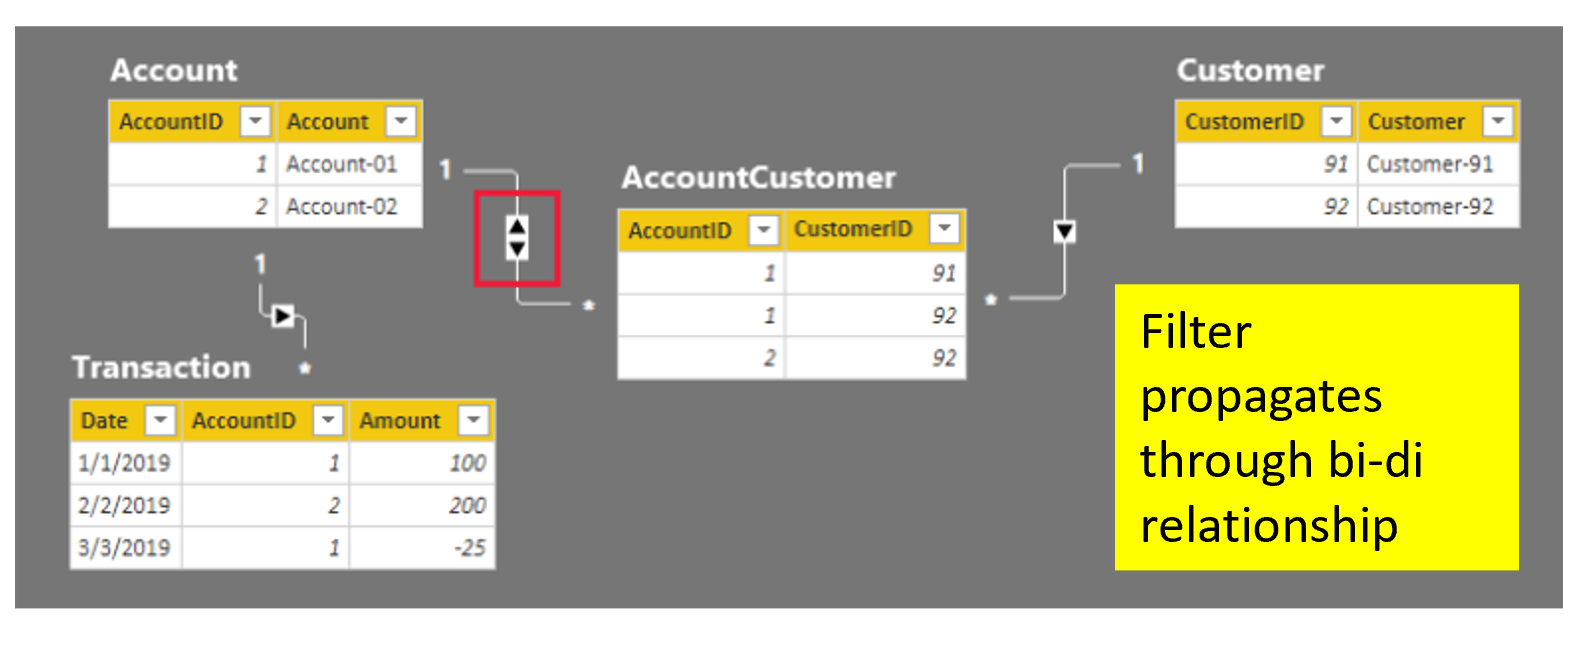
Changing the Account-AccountCustomer relationship filter to bi-directional fixes the problem and meets the reporting requirement.
As I mentioned, the bi-directional filter introduces a potential performance penalty. However, if the cardinality is low and the memory footprint of the data model is low and lean (using efficient key values and removing unnecessary columns), this design may perform just fine and you are good-to-go. I’ll demonstrate more creative techniques in part two of this two-part topic, as we explore more advanced data modeling design techniques.

Here all content so useful and helpful for beginner and experience both.This site is so amazing, This sites gives good knowledge of python with bi ,This is very helpful for me.
Hi Paul,
I have a model that I am struggling with a bit that was multiple many-to-manys that I used a bridge with (model is related to Grants (Grant can have 1:M donors and a Donor can have 1:M grants….. also a Grant can involve 1:M Areas (Region/Country) and a Region/Country can have multiple Grants).
The BridgeRelationship for GrantDonor isalso where the Fact.AwardedGrants (AwardDate,StartDate,EndDate,Various $$ smounts) is kept. I have 1 Date DImension with role playing (using the USERELATIONSHIP function).
I have come DAX Measures and have been able to get through the FILTERING of the bridge tables… but now, I can’t seem to get the DAX correct to filter it on the Award Date. I am not sure if it is due to the order of the DAX filtering or bad model.
(i.e. – need to use the multiple Date Dimensions)
Original: (before fixing the filtering across the multiple bridge tables)
——————————————————————————————————–
Total Grants Awarded = CALCULATE(DISTINCTCOUNT(‘Grant Award Info'[GrantID])
,USERELATIONSHIP(‘Date'[Date], ‘Grant Award Info'[AwardDate])
)
Updated:
——————————————————————————————————-
Total Grants Awarded =
CALCULATE (
CALCULATE (
DISTINCTCOUNT ( ‘Grant Details'[GrantKey] ),
FILTER (
‘Grant Details’,
CALCULATE (
COUNTROWS ( BridgeGrantArea ) > 0
)
),
FILTER (
‘Grant Details’,
CALCULATE (
COUNTROWS ( BridgeGrantDonor ) > 0,
USERELATIONSHIP ( ‘Date'[Date], ‘Grant Award Info'[AwardDate] )
)
)
)
)
Anyone have any tips how to resolve this?
Thanks,
Amy
alewis@fh.org
Hi Amy
It’s hard to work through a problem like this without having access to the model but I will share some initial thoughts. When I see a data model with a lot of M2M bridges and inactive relationships, it makes me wonder if the fact tables are being stored at the right level of grain. It isn’t always practical to model every table using simple one-to-many, single-direction tables but that should be the rule with few exceptions. It may be possible to create dimensions from values stored in the current fact table(s) that would simplify the model. This might be an option for grants and donors. Modeling changes aside, if USERELATIONSHIP doesn’t work as expected, you could try using another technique like TREATAS or CROSSJOIN. Post or tweet a link to a diagram of the applicable tables in your model and I can take a look.
Paul, are you open on Jan 13th at 6 pm to speak at the Austin Power BI User Group meeting? Would love to have you speak. @mattfloyd if you are.
Great learning material. Thank you!
Great article Paul, waiting for the second part.
Hi, I’m coming from a Qlikview background and truth be told I’m not exactly impressed with power bi. I’ve built the data model in a star schema and wish I hadn’t, the end users are saying that they are seeing customers where they haven’t made a sale, in Qlikview you would have the associative model where it will have green white grey based on what you can see, power bi you will see everything meaning you have to do a lot of work in power query, there is no concept of inner join unless you do some DAX measures. You might has well have the flat model at least on there you only see data where there is only a sales transaction, which means on the customer filter it will only show the customers that made a transaction.
Also when exporting a Matrix to excel, it does not keep the totals or conditional formatting!? Which is pretty poor, especially from Microsoft. You could say why would you want to export to excel!? Try telling that to 1,000 users this!?
Power BI compared to Qlik is terrible. How Microsoft managed to buy their way into the market is baffling.
I have to work in both platforms for my job(s) and every single time I cringe when trying to do something in Power BI.
The only thing as far as I can tell that PBI has on Qlik is the ease of sharing a dashboard to a website.
Hi Chris, I’m interested in your perspective about this. What exactly do you prefer about your experience using Qlik v Power BI? Most of us have bias and loyalties toward the products we know but approaching this with an open mind could be an opportunity to learn something.
I just reread my reply and wanted to clarify… I meant to say that I would like to approach learning more about a product like Qlik with an open mind and perhaps I could learn something by understanding your views. What exactly do you prefer about your experience using Qlik?