This post is part of a series of excerpts from my forthcoming book “Microsoft Power BI Data Analyst Associate Study Guide” from O’Reilly Press; from Part 2: “Using Power BI in the Real World“. As of this post, the online book is available as an early release through the O’Reilly subscription service and scheduled to be delivered through booksellers like Amazon early this year.
Cognitive Perception & Information Processing
You can be the greatest report designer on the planet, but if your report doesn’t meet the needs of the report consumer, it’s all for nothing. In this section, I break down the most important considerations for identifying your audience and their information needs. These are all factors to consider before you jump in and start designing your report.
When I started developing business reports early in my career, my role and the expected role of the report consumer were very clear. As a data professional in the IT department, I was the developer, and my readers, the consumers, used the reports I created to perform a business function—to do their jobs. Today the lines between data professionals and data consumers are not so clear and simple. Business users create reports for their own needs; data professionals create reports for business users; data analysts explore data to answer questions, without necessarily creating reports in the traditional sense. The concepts in this chapter apply to report consumers as well as report designers and creators.
Before jumping into this topic, your role and purpose as a report designer and developer. For whom you are creating reports? As a report designer and creator, you may design different reports for different audiences. The information your report presents may require a different layout and format, depending on its purpose.
When designing a report, I ask myself the following questions:
- What is my role—am I a report creator or consumer?
- Who is the intended audience for the report? Am I creating this report for myself, for my colleagues or for others?
- What are their information needs?
- Is this report supposed to meet a specific need or answer specific questions, or is its purpose more general? What information and use cases are outside its intended scope?
- What business metrics should be included?
- What is the level of detail for the report? Is the information in summary, in detail, or some combination of the two?
- What business function does this report support?
Reports can be colorful and attractive, but they must also fit business needs. Reports should provide information that a consumer needs to do their job or complete a specific task. The right format for your report could be highly visual and interactive, a simple grid of numbers, or some combination of the two, depending on the business need. Because there are so many details to consider when designing a visual report, it’s easy to spend an inordinate amount of your time and energy on trivial design features. Consider the context of the business user and what they need when they are reading or interacting with a report.
Cognitive Perception and Information Processing
I share some of my thoughts, let me be clear that I am not a psychologist or an accredited or certified expert in cognitive perception. This section is based on my observations while working in the tech industry for the past three decades. Artists and Engineers: Art and Science
People have different learning styles, and they experience the world around them with different perceptions. The tech industry tends to attract people with extreme talents and abilities, which is one of the things I love about working in the data community
With that in mind, modern data and business intelligence projects typically need professionals on both ends of the cognitive perception spectrum. The two brain hemispheres are typically associated with the different ways people experience and process information. The left hemisphere is logical and processes linear thoughts. The right hemisphere is artistic and creative and processes abstract thoughts.

Colloquially, we can call our ultralogical, process-oriented friends “left brainers,” while the artists and outside-the-box abstract thinkers are “right brainers.” I’ll also say that stereotypes can often be gross and unfair generalizations about people and the characteristics that make us all unique and special. In all fairness, most of us fall between these two extremes, but we all know people who live at either end of the scale. I work daily with data engineers who are absolute geniuses when building databases and data transformation frameworks but couldn’t design a visual report if their very existence depended on it. Likewise, some of the user interface and visual report designers in my circles exhibit brilliance and artistry in designing reports but couldn’t care less about moving data around.
Some time ago, I worked with Microsoft on a major IT project for one of the largest aircraft manufacturers in the world, I was tasked with replacing the reporting interface of an antiquated materials-management system for the design engineering division, which builds aircraft for the US Department of Defense. The old system displayed a lot of numbers in a grid, with no indication of status or outlier values. I mocked up a replacement report, using colors and databars to indicate how the material costs and quantities aligned to expectations. The lead engineer reacted sternly, saying, “We don’t trust pretty reports! Put the numbers in a grid.” Not only was the proposed format an unwanted change, but these report users were highly skilled engineers who didn’t want some data nerd doing any part of their jobs.
Accountants and financial controllers have, in my experience, reacted similarly: any attempt to replace traditional Excel spreadsheets and spreadsheet-like reports with modern visual reports tends to meet with strong resistance. Sometimes users just need to see the numbers. At other times, charts and KPI indicators help users visualize information differently and contextualize the data. A skilled report developer knows their audience and can apply the right report style to meet business users’ needs.
Over the past few decades, software companies have poured countless hours and resources into perfecting UI design. Most of us spend hours each day swiping, tapping, and clicking through visual interfaces shaped by the work of skilled design engineers and refined through extensive research and iteration. With so many examples of both effective and flawed designs already available, there’s no need to reinvent the wheel, which is why I advocate for applying established patterns where possible.
When viewing a report, our eyes scan the visual information, and our brains must quickly make sense of it. This process is entirely subconscious, based on synaptic pathways formed in our brains at a young age and influenced by our experiences and habits shaped throughout our lives. The fact is that people usually perceive information and facts unconsciously, without thinking about it. If you can design reports that enable this process to flow naturally, you will have achieved your mission as an effective visual report designer.

Have you ever driven home from work and noticed a sign or a building you hadn’t seen before, only to realize it had been there all the time? Our brains don’t actually record and digest all the information in front of us. Likewise, report consumers don’t read and process every object and every pixel on a screen or page. Their eyes scan the page, find patterns, and digest the most important information very quickly, without thinking about it.
Reading Patterns
It’s important to consider the habits and styles with which report users consume information. We don’t all see and process information the same way, but eye-movement studies reveal that there are common patterns to how most people view information on a screen. Again, I am not an expert in the field of eye movement and cognitive perception, but understanding these basic patterns helps me to design and arrange visuals more effectively.
In Western cultures, people learn to read from left to right, beginning at the top of the page, and this is the pervasive standard for nearly all international business users. However, most people don’t actually scan the content of an entire page: their eyes tend to jump from one area to another, along a path or within an area of interest. The path that their eyes follow is influenced by a few factors, such as the type of report they are viewing and their personal reading style. Researchers observe common patterns of eye movement such as the “F” pattern, “Z” or “lawnmower” reading patterns. There are many variations, so consider these patterns to be guidelines. Report users may adapt to one pattern or another depending on the layout, style and content of the report.
Citing: Neilson Normal Group, 2006, 2017: https://www.nngroup.com/articles/f-shaped-pattern-reading-web-content-discovered
The following depicts the F and Z reading patterns. The F pattern describes how many people start scanning a page quickly, beginning at the top left corner and moving to the right. Their second scan goes partway down the page, then straight down the middle to the bottom. An F-pattern report reader will notice information in the heading of the report and perhaps in the middle but will be less likely to see details lower on the page. In the Z reading pattern, the reader starts in the top left and reads like a typewriter to the right, then returns to the left, down, and then across.

The practical application of these patterns is that it’s a good idea to place summary information and the most important metrics in the top left corner. Conventional design places the page title or image in this space—but this is prime real estate, so don’t waste it. If a report should be branded with a company logo, I usually place it in the right-hand corner. It stands to reason that if the top left corner of the page is where readers start, the value of the space decreases as you move toward the bottom right corner of the page.
Design your reports with the F pattern in mind when the content is text-heavy or tabular, using a table or matrix visual with hierarchies to enable users to explore. Since the top left corner of the page gets the most attention, place important metrics and KPIs at the top, with summary information. Design your reports with the Z pattern in mind when you’re arranging islands of visuals and consider the order in which users are likely to read them. (Again, this is not an exact science.)
I mentioned that most Western cultures read from left-to-right, but what about right-to-left readers? According to the previously cited Neilson Normal Group studies, the F and Z eye-movement patterns apply to right-to-left readers but in the inverse. If your audience are right-to-left readers, you can design reports accordingly but be cautious not to exclude a portion of the audience who are unprepared for the change. In the International world of business, standards are established for the median audience and the pervasive culture of the organization. I believe that the answer lies in knowing and understanding the needs of your audience.
The data-to-ink ratio
The data-to-ink ratio is a concept introduced by Edward Tufte in his book The Visual Display of Quantitative Information (originally published in 1983; the second edition is from Graphics Press, 1997). I attended a presentation on this principle by Professor Tufte that changed my view about visual design. The term data-to-ink ratio refers to the proportion of the “ink” (or pixels) in a visual that represents data, versus that used for non-visual elements like titles, borders, background shading, gridlines and other adornments. These elements can enhance the visual, but Tufte refers to them as “chart junk” if they don’t contribute to making the data more readable.
Imagine that you are printing a report (an old notion, for a lot of us) that uses a certain number45% of its pixels for information and the other 55% for borders, backgrounds, shading, titles and labels. Think of it from this perspective: when it comes time to replace your ink or toner cartridge, how much of that cartridge did you spend on data and how much on chart junk?
Subconsciously, in a few seconds, our brains must process all this information and decide what is relevant and important. Emphasize what matters most and let the data speak for itself. You can improve the data-to-ink ratio by reducing background shades and colors and removing 3D effects [s13] and other unnecessary adornments. Borders and drop shadows can help you emphasize visual information without competing for screen space and attention.
Two column charts appear side by side in this example Every pixel used to render the visual must be viewed by the user’s eye, processed by their brain, and interpreted as information. In effect, when you look at a visual, you take a picture of it in your mind and then discern the useful information from the less useful stuff.
Try this: Focus your eyes on the chart on the left and count to three. Now look away and describe what you saw. Did you see the heavy border, the gray background, the title, and the dotted reference lines? By chance, did you also notice the values represented by the columns—or did you not get that far?
Under the right circumstances, each of these elements—titles, borders, background—may individually serve a purpose, but together they can also distract from the most important part of the visual: the data.

By contrast, the chart on the right clearly visualizes the metric values and trend over time, without unnecessary chart junk. Try the three-second test with the chart on the right and then see what you can recall. All by itself, the visual lacks context, but titling it might be unnecessary if the report page explains its purpose.
For more on layout, design, and use of space, please see the following resources:
- Power BI Visuals Reference
- Stephen Few, Perceptual Edge
- Ben Schneiderman, Information Seeking
The Gestalt Principles
The Gestalt principles are a set of psychological rules that explain how people naturally perceive patterns, groups, and structure in visual information by organizing complex images into simpler groups and wholes. The column chart below is an example of this principle.
Literally speaking, what you see in this image is a group of rectangles of various sizes that are aligned at the bottom. They are evenly spaced and have corresponding text below each rectangle. What does your mind envision when you look at this group of shapes?

Rather than seeing the individual shapes, your mind finds a pattern that aligns to your understanding of time and measurements. In other words, when your mind finds a pattern, it draws an imaginary line that transforms a bunch of rectangles into a time series. In a series, you perceive that values change progressively from one period to the next. You can’t help but compare one value to the next and notice that they go up or down over time.

The Gestalt principle can work against you by suggesting patterns that may not actually exist. The next image shows the same column chart as before but grouped by product color rather than date. With the horizontal axis of the chart sorted by values, it seems to suggest that the values progress from one axis value to another, but this distorts the truth. There is in fact no correlation between the sales values for each product color, and certainly no progression of values from one color to the next. There is no rule that you can’t use a chart like this to visualize category values in order, but it would be advisable to avoid using the same type of chart on the same page as one with a time series on the horizontal axis, as shown in the previous examples.

To avoid the illusion of the progression of values in a series, you could sort the product colors alphabetically to provide a logical ordering of category values on the horizontal axis.

Segmentation and Series
The column chart visualizing values by product color is an example of value segmentation, when values are grouped for comparison rather than being shown as a series of continuous values. A column chart is an appropriate visual to use for series analysis, but a line chart or area chart might be even more effective if your purpose is to show how values progress from one period to another. The next chart is the same visual as before, except that the column chart with the Date field on the X axis has been changed to an area chart. For reference, I also added Y axis values and data labels to show the value of each point along the X axis. Is this an honest representation of these values?

When I switch the chart type, the Y axis scale defaults to Auto, which means that the baseline or bottom of the scale is lowest value for the date range (2.5) and the highest value on the scale is the maximum value during that period (4.7). This range visually demonstrates a steep increase in values. Before you answer the question, I will point out that this type of chart, with this representation of data values, is very common in the business world. You probably see real examples all the time on websites and news feeds. For example, if you look at stock trends, you will see a line or area chart like this one depicting stock values for a certain period of time—and the variation of those values in the chart will be from the lowest to the highest value. The range could be from 99 to 100 or from 1 to 100.
Back to the question: Is this an honest representation of the series values and the trend over time? The answer is “It depends, but it is certainly an exaggerated view.” In the next example, I have changed the Y axis range to start at 0 rather than the minimum value. You can clearly see that the increase over time is not nearly as substantial as was previously depicted.

The point is that your report must inform the reader about what they are seeing and about how the visuals represent the data. By adding the Y-axis values, readers can see where the range values start and end. In the stock market, it is well understood that trend charts don’t include zero and only show variations from minimum to maximum, but this is not the case in all business scenarios. So it is up to you, the report designer, to communicate effectively and honestly to your report consumers.
A few bad examples
The next bar chart is similar to the previous column chart example, but its bars are arranged vertically along the Y axis. Although this visualizes the same data as the earlier column chart example with the dates on the X axis, our minds are accustomed to visualizing dates from left to right. For most report readers, this is not a natural visual format for time series reporting. A column, line, or area chart would be a better choice.

Proportions and Pie Charts
Let’s go back to the F and Z reading patterns. Our eyes and our minds are very good at comparing the heights and lengths of things. We naturally scan and compare things along a vertical or horizontal plane. Therefore, column charts and bar charts are visual patterns that work naturally with the way our eyes and minds scan and visualize information. Circles are a completely different matter. To make sense out of information that is arranged in a circular fashion, it can send your brain into overload. It requires your mind to calculate angles in different positions along a circle, and circles and angles are far more difficult to comprehend than vertical and horizontal lines. I’ll show you some examples to make this point.
Pie charts have their place, but they are often misused. To show the relative proportions of two, three or four values, a pie chart might be a good option. However, the example shown below demonstrates why a pie chart is not a good choice when used with too many values—particularly values that are too close to approximate in a visual. This is the same data visualized in the previous two column chart examples, but it is far more difficult to use. Even with the value labels, this visual is confusing and useless. Avoid using this type of chart to make comparisons when accuracy is important, or with more than just a few values.

We have all grown accustomed to using pie charts to visualize proportional values, but most people don’t realize that this format can skew their perception. This is a simple pie chart with four category values.

This example shows the same chart with crosshair lines added for comparison. Does this make the comparison easier? Now you can see that the slice in the top left quadrant, representing Category 4, is the largest. Next is Category 2. Category 3 has the smallest value.

This shows why pie charts are not an effective way to compare values that are too close to measure side by side. Column or bar charts are better for that purpose.
Pie charts are an effective way to depict approximate proportions for comparison, but they don’t work very well with too many values or when the variations are small or subtle. The next example shows a pie chart with three categories and account type values. The data labels provide example values for the slices that show approximate proportions.

One of the drawbacks of pie charts is that they use a lot of screen real estate to visually compare only a few values. Their data-to-ink ratio is low: it takes a lot of ink to represent a little bit of data. If you put a hole in the middle of the chart, the pie becomes a donut, with a convenient space to add another value related to the segmented values in the chart. The next example shows a donut chart with a round card displaying a measure called Plan Amount Net, which is related to the three values shown in the chart. The card the donut chart has the background removed, so it becomes transparent.

This uses the same amount of space on a report page to visualize more data and increases the data-to-ink ratio without adding clutter to the page. Overlaying visuals can be tricky, but it’s effective when used in the right balance.
This report page example includes multiple visuals that apply these principles. For some refinement, you can add finishing touches with styling. In the example, I have added small, subtle rounded corners with no borders and subtle drop shadows.
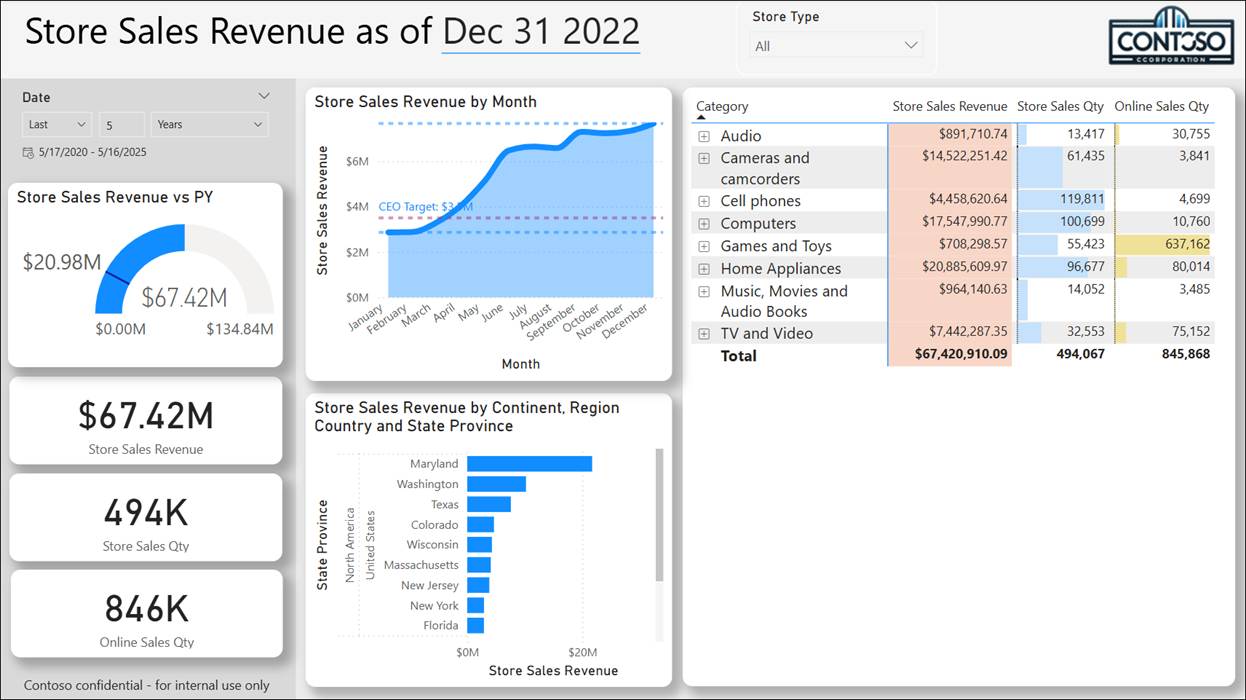
This part of report design is an artistic endeavor. If you are a “left brainer,” this is a good time to enlist a “right brainer” and get an artistic perspective. Regardless, you should get a second opinion, test the visual interactions and features. An impartial observer will find seemingly obvious areas for improvement when you are ultra-focused on the details and perhaps unable to see the forest for the trees.
Be sure to test each visual to make sure the color choices work in contrast to the background. Check the slicers to ensure that the dropdown lists, background fill colors, and fonts are readable. Adjust font sizes if necessary. Make adjustments until everything fits and functions.

One thought on “Power BI Fabric Patterns: Guidance for the Visual [Design] Impaired”