Back in September 2025, about four months ago, I made this earlier post, as we were just gaining early experience with this feature. Excuse the duplication, but this capability is progressing quickly and we’re learning more about optimizing the Copilot experience with experience. Expect more to come as Copilot for Power BI and “Chat with your data” becomes more and more mainstream.
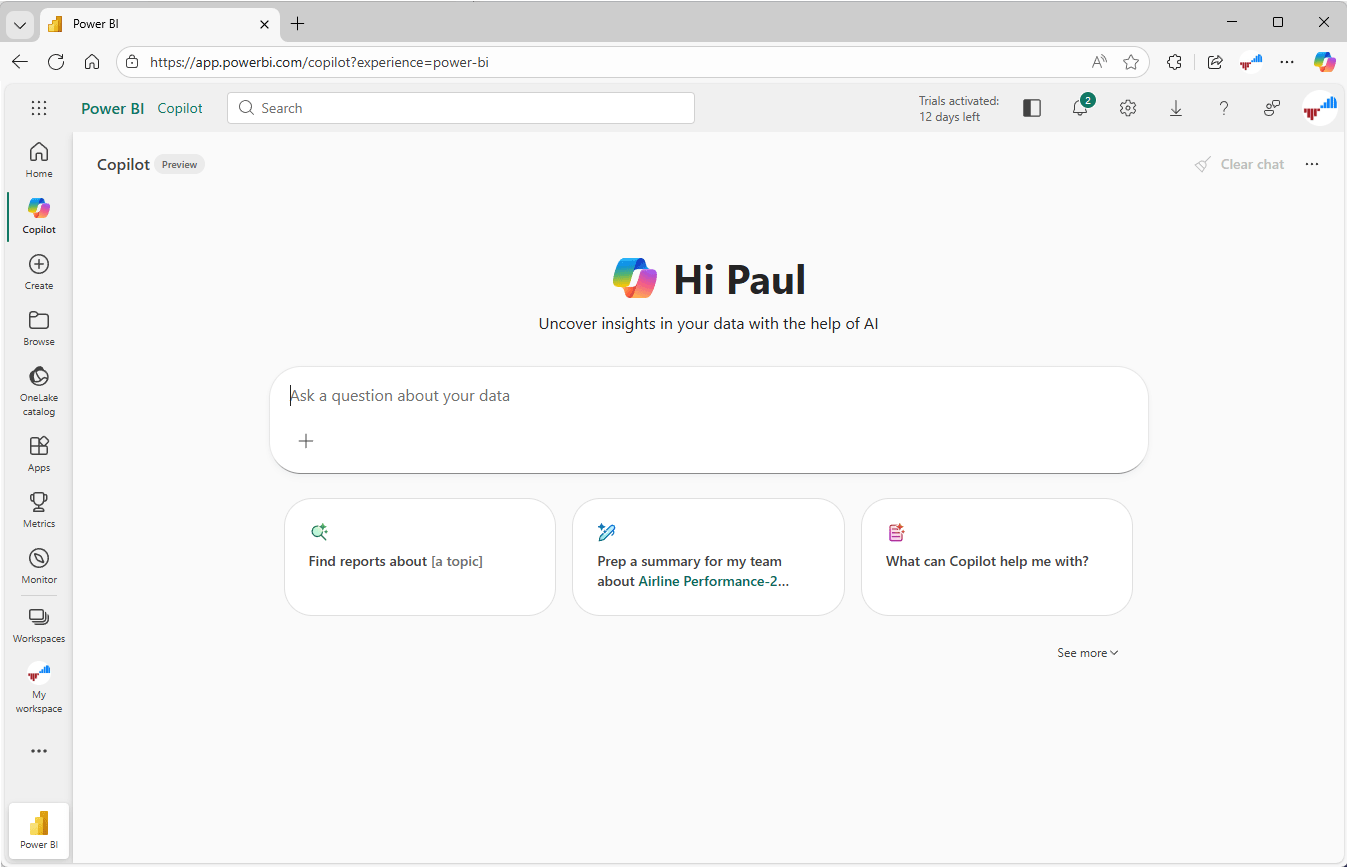
Copilot for Power BI… OMG, that can mean about a dozen different things! Of course, you know what Copilot is unless you’ve been living under a rock. Copilot is Microsoft AI companion for just about Microsoft product or service. It shows up as a prompt either in a panel on the right side of the screen or in the center of the browser page. Copilot invokes an AI-base chat agent that sits on top of a large language model (LLM) and uses conversation prompts to answer questions with natural language. For this discussion, we’re going to put aside all the Copilot integrations that help writing code and designing solutions and focus on how to enable and enhance the Copilot Power BI user experience on the Power BI Home page. That page looks like this after you click the Copilot icon in the left navbar.
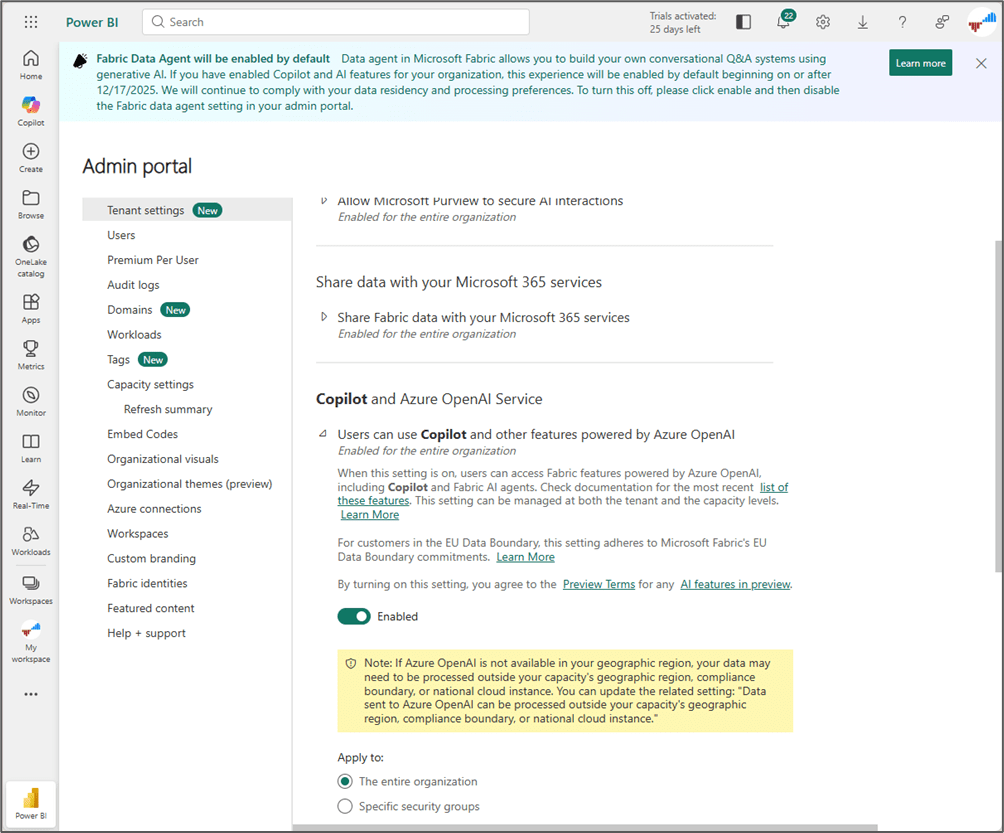
You don’t see Copilot? Let me show you how it is enabled. There are a few related settings in the Admin portal that you should read through carefully.
Users can use Copilot and other features powered by Azure OpenAI
This is the setting that enables Copilot in the Fabric/Power BI tenant. You can enable Copilot functionality for all users or only those in specific security groups. This is the master switch for all Copilot functionality across Fabric workloads, enabled by default. Can be applied to entire tenant or specific security groups, and is automatically delegated to capacity administrators who can override tenant settings. This is the only setting needed to enable Copilot.
These additional settings give administrators more control, particularly when Copilot is used in an organization-wide rollout for a governed environment:
Data sent to Azure OpenAI can be processed outside your capacity’s geographic region: Allows Copilot data processing across geographic boundaries for customers outside EU/US regions. Required to enable Copilot features when capacity is located in regions without local Azure OpenAI services.
Data sent to Azure OpenAI can be stored outside your capacity’s geographic region: Enables conversation history storage for Copilot in Notebooks and data agents to maintain context across sessions. History is stored for 28 days within Azure security boundary and can be manually cleared by users.
Users can access a standalone, cross-item Power BI Copilot experience: Enables dedicated standalone Copilot interface in left navigation for Power BI users. Will be enabled by default starting September 5, 2025 for tenants where Copilot is already active.
Only show approved items in the standalone Copilot in Power BI experience: Restricts standalone Copilot to search only content marked as “Approved for Copilot” by workspace administrators. Provides content governance to ensure users discover only vetted, high-quality content.
Capacities can be designated as Fabric Copilot capacities: Allows capacity admins to designate specific capacities (F2 or P1 minimum) for consolidated Copilot billing and usage tracking. Becomes enabled by default February 12, 2026.
Fabric data agent: Enables users to create natural language Q&A experiences over data sources using generative AI. Enabled by default and requires Copilot and Azure OpenAI settings to be active.
Copilot Capacity Management
How much capacity is Copilot going to use and should it be assigned to a specific Fabric capacity? It depends and assigning Copilot to its own capacity is the best way to monitor and manage it. However, that doesn’t mean that you must purchase a sperate capacity to get started using Copilot. Using Copilot doesn’t cost you anything beyond the Fabric or Power BI capacity(ies) you have already purchased as long as it doesn’t slam your capacity and cause other workloads to be throttled.
As with any workload, watch the Fabric Capacity Metrics app to monitor your capacity use and make sure you are not running hot. You can also set utilization threshold notifications to be alerted when a capacity reaches a certain percentage of utilization. set usage shows the CU load for Copilot. The Fabric Capacity Metrics app include a specific category to monitor “Copilot in Fabric” which runs as a background workload in the service. This article describes example Copilot workloads and methods to calculate usage: Copilot consumption – Microsoft Fabric | Microsoft Learn. A typical estimate for a Copilot session is 2500 OpenAI tokens which equates to just under 7 Fabric CU minutes which, according to the article, equites to about one CU minute per hour of capacity usage. Given this example, at that level of usage, a customer with an F64 capacity would support over 13,000 requests per day. By extension, the cheapest capacity, an F2, would support about 430 requests.
The simple story behind Copilot usage in Fabric is that it competes for resources just like every other workload. If you light-up Copilot in your Fabric environment, by default it will run in your default capacity. If using Copilot maxes out the capacity, it will initially burst (allow you to overrun your capacity for a short time) and won’t block other workloads until usage reaches the bursting threshold. Unless you enable Surge protection in the Admin portal, at that point, the capacity will throttle (slow down at first and then eventually fail) and block other workloads while the backlog of exhausted capacity units is recovered (Understand your Fabric capacity throttling – Microsoft Fabric | Microsoft Learn). In a test environment, there is nothing wrong with this and it won’t cost you extra to experiment and test the water with Copilot or any other Fabric workloads. You do risk throttling your capacity and realizing the effects of bursting and smoothing if you don’t monitor usage and take steps to mitigate it. Having worked through this exercise with a few clients thus far, I have three recommendations that depend on size and scale of the environment and audience:
- If you are a small organization with a simple Fabric deployment and can tolerate occasional service interruptions or performance impacts, use the Fabric Capacity Metrics app to make sure you are consistently running within a reasonable margin of capacity utilization (perhaps 50%). Set a capacity threshold and notification (75% recommended). After enabling Copilot and teaching users how to use it, watch the usage and decide whether you can maintain the appropriate headroom or if you need to manage Copilot in a separate capacity.
- If you are a moderate size organization with critical production workloads, you can assign Copilot to run in a non-production capacity that may also be shared with testing and development resources. Monitor usage with the Fabric Capacity Metrics app and use notifications to avoid exceeding thresholds. At minimum, Development and Production environments should be contained and managed using separate capacities.
- If you are an enterprise-scale organization with critical Production and Development workloads, you should create a new capacity for Copilot and monitor it alongside your other prod and development capacities. In addition to the Fabric Capacity Metrics app and threshold notifications, consider using the Fabric Unified Admin Monitoring (FUAM ) solution accelerator to monitor the Fabric estate and make capacity size and allocation adjustments as needed. You can start with a small capacity to manage Copilot and scale-up as necessary.
Power BI and Fabric Copilot Integrations
In the rest of this article, I am going to focus on the Copilot for Power BI Home experience, but I’ll start with a quick overview of all the places you will encounter Copilot across all of Power BI and Fabric. The current Copilot integrations for Power BI are categorized as follows:
Report Designer
Like other Microsoft products, clicking the Copilot icon in the top ribbon of the desktop or web report designer opens a panel on the right side of the report. Here, Copilot can add visuals to a report page, create new pages and answer questions within the context of the report.
The DAX query view editor in Power BI Desktop can use Copilot to generate and update DAX code in the existing report and semantic model.
The browser-based Dataflows Gen2 Power Query design includes some Copilot integrations that will likely be expanded, and those integrations may find their way into Power BI Desktop in the future.
Fabric Data Engineering
There are several Copilot integrations in the Fabric developer tools which include:
Data Factory Pipelines: Pipeline generation from natural language descriptions, error message assistant with troubleshooting guidance, activity recommendations
Data Engineering & Data Science Notebooks: Natural language queries about lakehouse tables, Power BI datasets, pandas/Spark dataframes, code generation for data analysis and visualization, model type recommendations
Data Engineering & Data Science Notebooks: AI-powered context-aware code suggestions as you type, industry-standard code templates
Data Warehouse: Natural language to T-SQL query generation, AI-powered code completion, quick actions (Fix and Explain queries), intelligent schema-aware insights
SQL Database: Natural language to SQL for OLTP scenarios, context-aware code completion, quick actions (Fix and Explain), document-based Q&A
Real-Time Intelligence: Natural language to KQL query generation, KQL code suggestions, query optimization, support for Public and Private Shots databases with custom domain-specific examples
Fabric Data Agents: Natural language conversations about enterprise data with schema understanding, governance enforcement, business context interpretation, integration with Microsoft Copilot Studio for multi-agent orchestration, query Power BI semantic models via XMLA endpoints.
Think of Copilot as a young child or a pet that is learning discipline and obedience. It’s smart, capable and has great potential. It will learn as you begin interacting and will improve with repetition and contextual experience.
It needs guidance
It learns through repetition
It will figure some things out
It will grow up
Taming Non-deterministic behavior
As a technical professional, I have grown accustomed to running program code and queries that have very predicable outcomes. If the same code runs multiple times with the same data, it will always produce the same result. This is not the case when interacting with artificial intelligence agents – at least not at first. An agent might give slightly different answers to the same question because it considers a lot of possibilities. It will explore different angles, offer creative options, adapt to the situation, and keep things from feeling rigid or repetitive.
Agentic AI users should understand this non-deterministic behavior and should be prepared to validate the answers they receive from agent interactions. Users are accustomed to using AI in the wild to get answers based on Internet searches. Although Copilot for Power BI uses an LLM for linguistic understanding, to understand a user’s meaning, synonyms and phrasing, it doesn’t use external information to answer questions. Copilot will only use data exposed through semantic models and reports other specified data sources in its responses.
Solution developers, we can prepare data models and train agents to produce deterministic outcomes and improve accuracy and user confidence. Each step on this slide, from bottom to top, will improve the Copilot experience, and its ability to translate prompt questions into accurate results. Not all of these recommended steps are required but each are likely to improve the outcome and help Copilot find the best data to match questions.
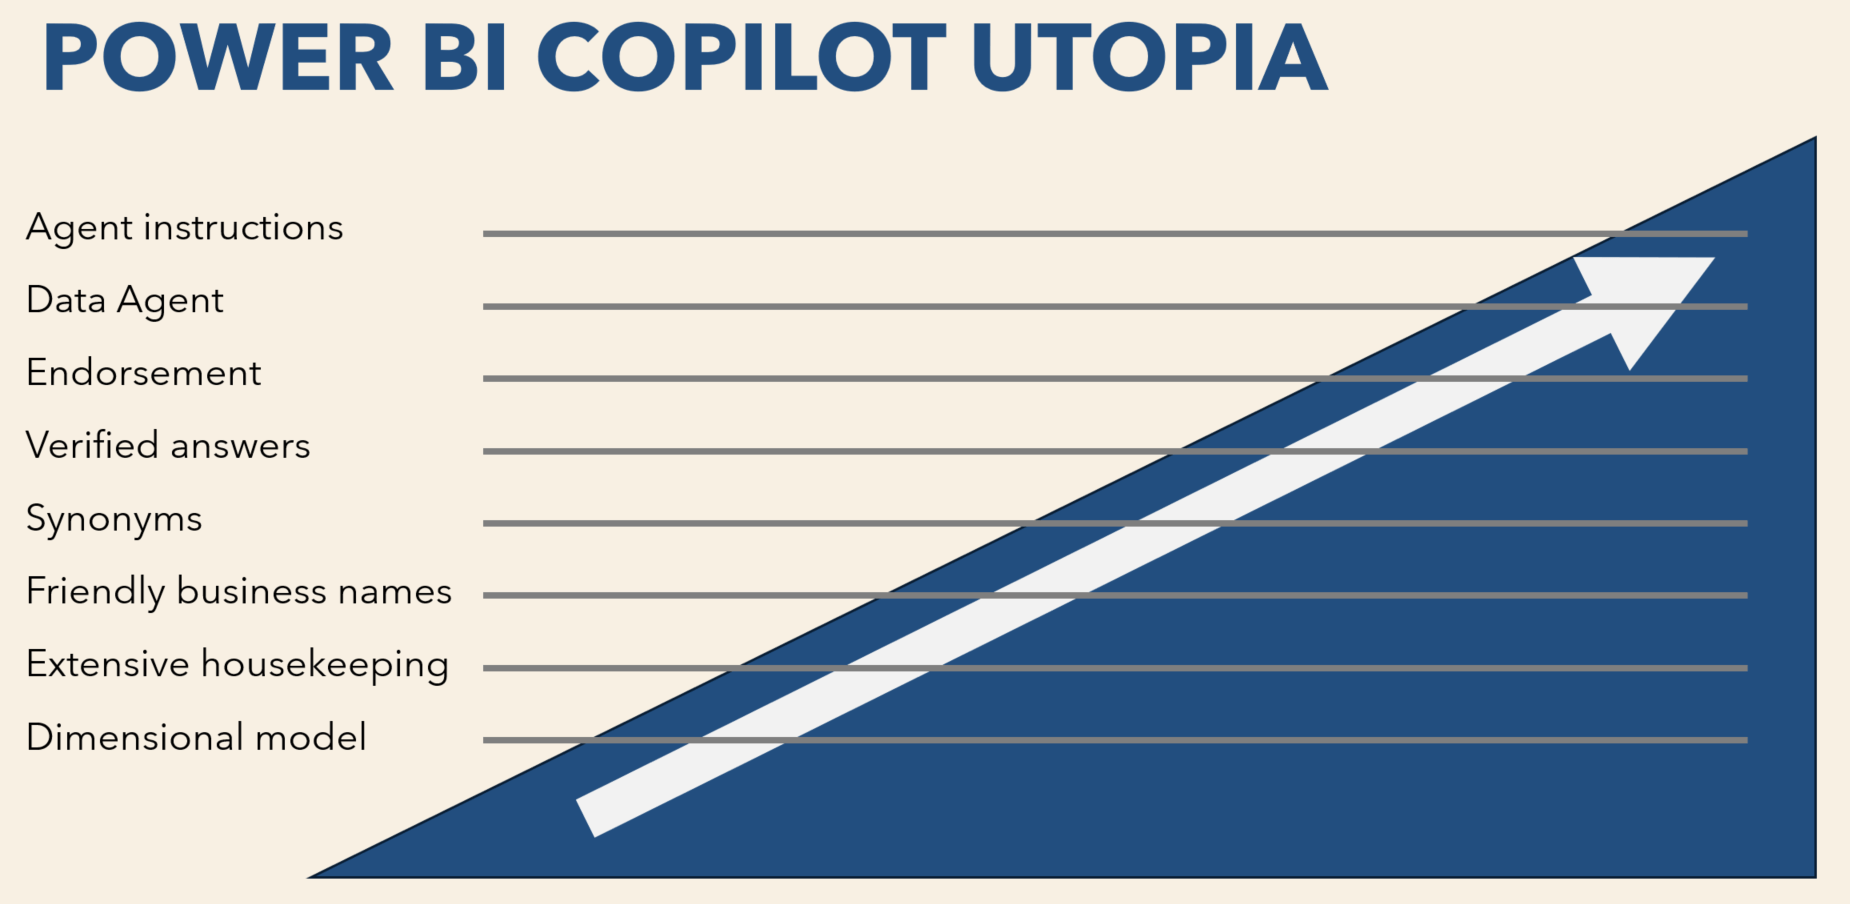
Recommended steps in rough order of priority:
- Dimensional model – This is the basis and foundation for efficient and reliable analytic reporting and now more important then ever for Copilot. Tables in each model must be related using proper directionality and cardinality. Because Copilot generates DAX queries from user prompts, it must be able to locate measures to perform calculations and dimensional attribute fields for grouping, filtering and slicing the measure values. Although ideal, semantic models are not limited to pure star schema design, so long as queries are supported by relationships that enable filter propagation and contextual calculations.
- Extensive housekeeping – More than ever, semantic models must be clean and as simple as possible, following dimensional modeling rules and best practice design. Clean house and reduce clutter… get rid of every column not needed for reporting and hide all fields not used on reports.
- Friendly business names – Users ask questions using business language and natural language phrasing. Copilot will be challenged with cryptic and complicated table and field names. Rename every field and object imported from data sources that use camelCase, snake_case, USER_CASE, PascalCase, cryptic abbreviations or any other technical naming standard. Hide the rest.
- Synonyms – Although Copilot has the ability to infer alternate wording for fields, measures and other object names, relying on Copilot’s real-time synaptic interpretation increases token usage and response time. Synonyms have existed in Power BI long before agentic AI and still provide an efficient way to translate queries using alternate words and phrases to object names in the semantic model. Especially for objects with common synonyms, providing a list of alternate names is still the most effective way to support ad hoc user queries.
- Verified answers – Providing verified answers is part of the grounding exercise that optimizes Copilot for Power BI. Verified answers are stored as referenced DAX queries within the semantic model and are used to guide Copilot to use accurate queries to produce prompt responses. They either provide validated queries that Copilot will use to produce new visualizations or query patterns it will use to generate new query responses.
- Endorsement – Copilot prioritizes certified and promoted semantic models and reports when searching objects to query as part of an organization’s governance policy. Copilot can be set to only consider objects that meet data governance criteria.
- Approved for Copilot – Similar to endorsements, only semantic models and reports approved for Copilot might be used or will set reliability expectation, based on the Copilot configuration. Copilot warns users when non-approved models and reports are used to answer questions.
- Data Agent – Rather than relying on the default Copilot behavior or the user to select a specific semantic model or report to answer a question, a Fabric data agent acts as an optimized prompt redirector. An agent may be connected to multiple models and data sources with specific instructions and example queries – for the agent and for each data source.
- Agent instructions – Like verified answers, agent AI instructions provide guidelines and grounding criteria to help the agent direct Copilot to use the best data source or semantic model to respond to the prompted question.
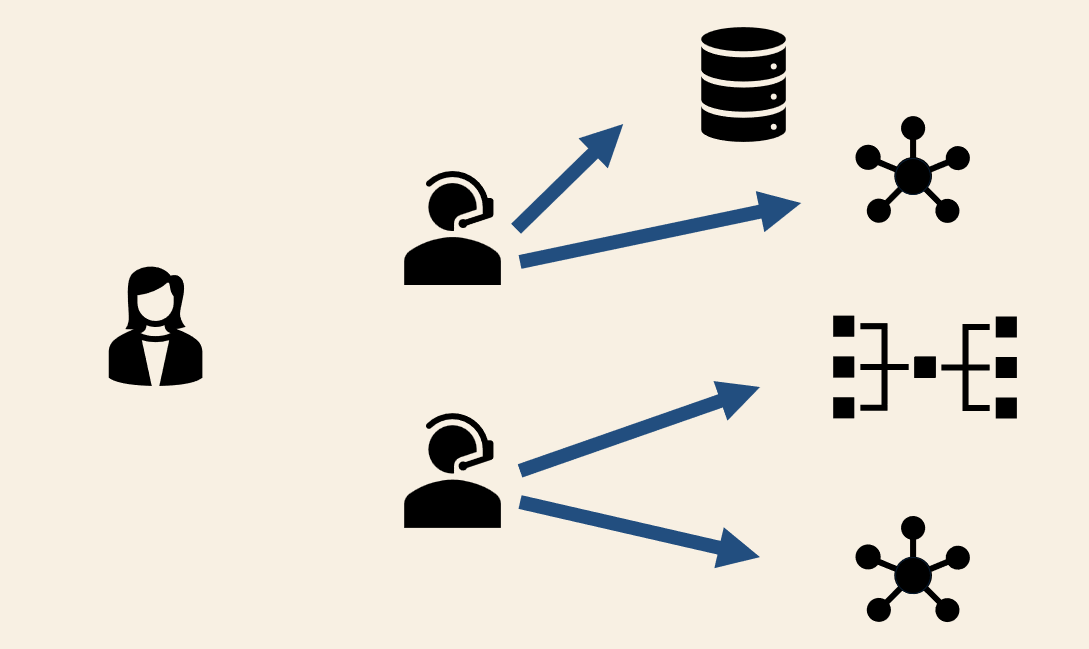
Life without Copilot
Without Copilot, users must choose the data sources, databases and semantic models they query to obtain answers to business questions. They must know the data estate and what data sources, semantic model, fields and measures to use.
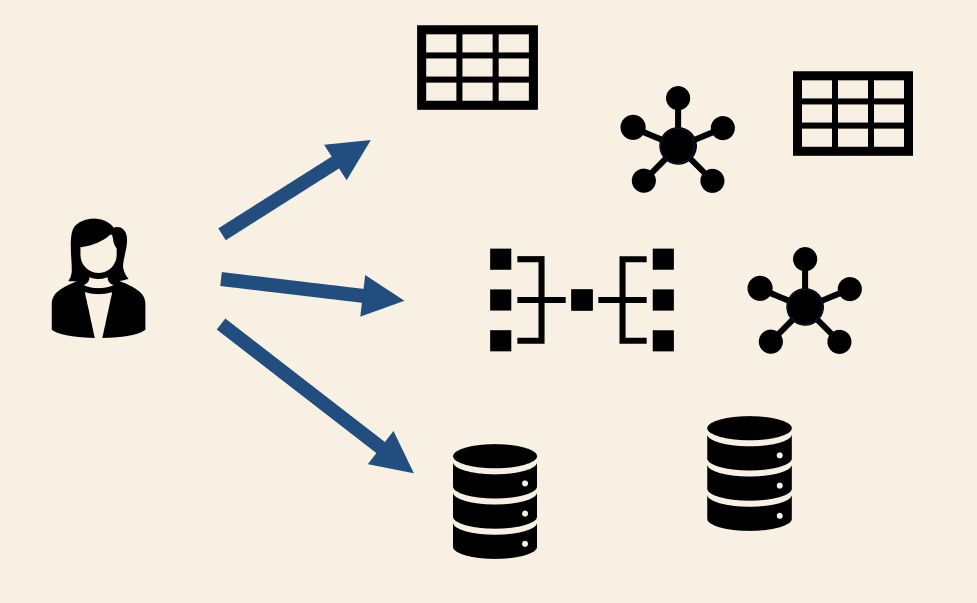
Using Copilot, they are directed to one or multiple semantic models that have been optimized for use with Copilot.
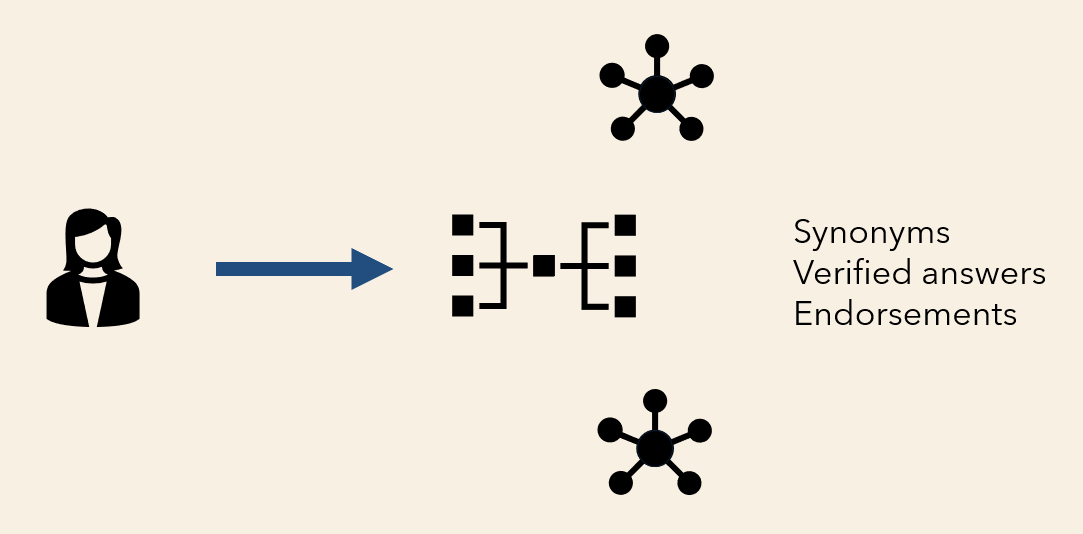
Preparing Models for Copilot
Step 1: The Basics
Dimensional model design
Filter propagation, correct cardinality, filter direction
Explicit measures
Table, field and measure naming conventions
Remove the junk
Add descriptions to all applicable objects
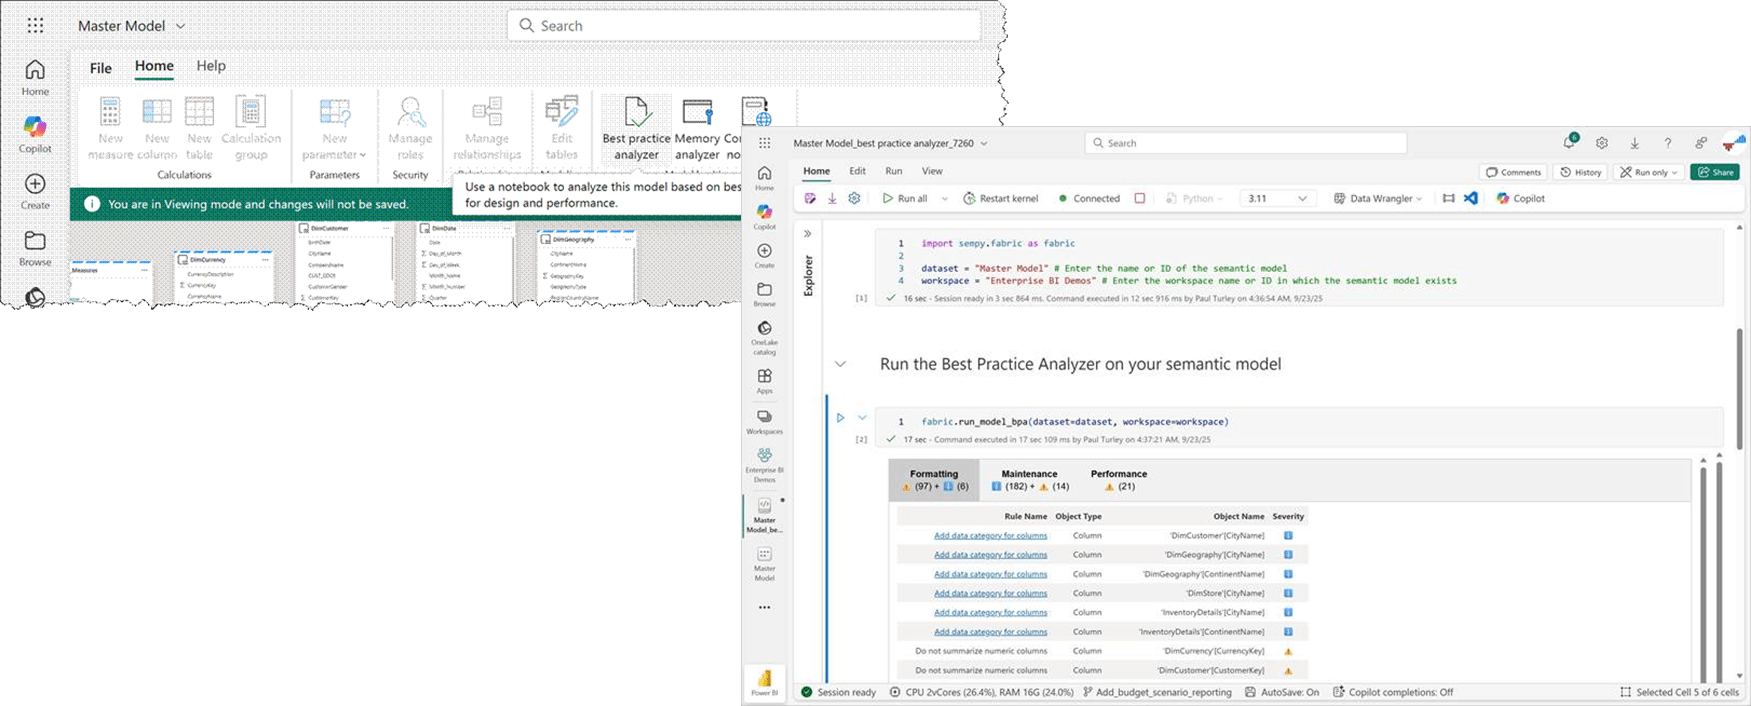
Step 2: Use the Best Practices Analyzer
Initially introduced in Tabular Editor as a community supported tool.
Rules defined using dynamic LINQ expressions stored in JSON files.
Tabular Editor BPA rules are open source, managed in a public GitHub repo – over 100 rules.
Fabric BPA is managed by Microsoft & implemented in Semantic Link for Python (SemPy) in a Fabric notebook
About 30 rules, focused on Copilot preparation.
BPA Rules for Copilot Modeling
| Table Linking | Define Clear Relationships | Ensure that all relationships between tables are clearly defined and logical, indicating which are one-to-many, many-to-one, or many-to-many. |
| Measures | Standardized Calculation Logic | Measures should have standardized, clear calculation logic that is easy to explain and understand. |
| Measures | Naming Conventions | Names for measures should clearly reflect their calculation and purpose. |
| Measures | Predefined Measures | Include a set of predefined measures that users are most likely to request in reports. |
| Fact Tables | Clear Delineation | Clearly delineate fact tables, which hold the measurable, quantitative data for analysis. |
| Dimension Tables | Supportive Descriptive Data | Create dimension tables that contain the descriptive attributes related to the quantitative measures in fact tables. |
| Hierarchies | Logical Groupings | Establish clear hierarchies within the data, especially for dimension tables that could be used to drill down in reports. |
| Column Names | Unambiguous Labels | Column names should be unambiguous and self-explanatory, avoiding the use of IDs or codes that require further lookup without context. |
| Column Data Types | Correct and Consistent | Apply correct and consistent data types for columns across all tables to ensure that measures calculate correctly and to enable proper sorting and filtering. |
| Relationship Types | Clearly Specified Relationships | To ensure accurate report generation, clearly specify the nature of relationships (active or inactive) and their cardinality. |
| Data Consistency | Standardized Values | Maintain standardized values within columns to ensure consistency in filters and reporting. |
| Key Performance Indicators (KPIs) | Predefined and Relevant | Establish a set of KPIs that are relevant to the business context and are commonly used in reports. |
| Refresh Schedules | Transparent and Scheduled | Clearly communicate the refresh schedules of the data to ensure users understand the timeliness of the data they’re analyzing. |
| Security | Role-Level Definitions | Define security roles for different levels of data access if there are sensitive elements that not all users should see. |
| Metadata | Documentation of Structure | Document the structure of the data model, including tables, columns, relationships, and measures, for reference. |
| Measures, Tables, and Columns | Descriptions | Include what it is and how you intend each element to be used in the description property. Note: Only first 200 characters are used. |
| Calculation Groups | Descriptions | Calculation items aren’t included in the model metadata. Use the description of the calculation group column to list and explain the use of the calculation items. Note: Only first 200 characters are used. |
Step 3: Prep Model for AI
Simplify the data schema
Hide or remove unneeded columns
Use friendly naming conventions
Add synonyms
Step 4: Verify Answers
Authoritative, curated definitions that provide a single source of truth for common business questions.
Integrated with the semantic model, grounding answers in DAX, metadata, and model logic.
Natural language question mapping using predefined phrasings and synonyms to match user queries.
AI guardrails for Copilot, ensuring consistent, trusted, non-hallucinated responses.
Governance and standardization, improving trust, consistency, and self-service BI alignment across the organization.
Step 5: AI Instructions
Clear and specific guidelines to avoid ambiguity.
Instructions for the semantic model — reference approved tables and measures.
Consistent business terminology, align with glossary and Verified Answers.
Provide sample prompts — show the expected style or format.
Define scope and guardrails to limit the agent to trusted data and logic.
I need to Talk to an Agent

Data agents:
Direct the conversation to specific data sources and semantic models
Focus the context of prompts using instructions
With Copilot & Data Agents