This post is part of a series of excerpts from my forthcoming book “Microsoft Power BI Data Analyst Associate Study Guide” from O’Reilly Press; from Part 2: “Using Power BI in the Real World“. As of this post, the online book is available as an early release through the O’Reilly subscription service and scheduled to be delivered through booksellers like Amazon early this year.
Fabric Data Days and the Analyst Engineer Certification
I had the pleasure of hosting eight hours of two-hour-long study group sessions for the Microsoft-sponsored Fabric Data Days in November and December. The event was coordinated and promoted by the Fabric and Power BI Community. As a group, we reviewed live demonstrations and preparation materials for the DP-600 Data Analyst Engineer exam. I’m proud to say that all of the attendees who participated in the four sessions have since passed the exam!
Whether you or your employer are interested in certification, Microsoft have done a remarkable job identifying three important roles related to BI and analytical reporting projects. There are three certification exams that effectively define the roles associated Power BI and the Fabric data platform:
Data Analyst – creates desktop and small-scale Power BI solutions. The PL-300 exam is the entry point for Power BI that encompasses basic skills and building blocks for high roles. A Data Analyst transforms business questions into actionable insights using Power BI by applying use skills in data preparation, semantic modeling, and DAX to design interactive dashboards and reports. Their typical activities include connecting to data sources, creating measures and KPIs, applying row-level security, and publishing reports that help stakeholders make informed decisions.
Data Engineer – Typically, a different skillset and mindset from BI analytics; assessed in the DP-700 exam. Data Engineers are responsible for building and maintaining the data infrastructure to support analytics, bringing skills in PySpark, SQL, and Fabric pipelines to ingest, transform, and store data at scale. Typical activities include connecting external sources, cleansing and structuring raw data in Lakehouses or Warehouses, optimizing pipelines, and enforcing governance so analysts and engineers have reliable, high-quality data.
Analytics Engineer – The DP-600 exam contains elements of both data analytics and data engineering with a business focus. It is the fence-sitter between the disciplined worlds of data engineering and the abstract creativity of analytics. An Analytics Engineer bridges data engineering and analytics by building enterprise-ready solutions in Microsoft Fabric. Combines skills in SQL, DAX, and KQL with expertise in data modeling and performance optimization. They design and manage dataflows, create semantic models, optimize datasets, and ensure governance to deliver curated, analytics-ready data assets for reporting and analysis.
Enterprise BI Solutions Need Analytics Engineers
Time after time, I see Power BI solutions created by data engineers and application developers with cryptic object names and heavy on programming code. An Analytics Engineer remains focused on the business problem and the needs of business report users with an understanding of data architecture and data modeling. They are typically not mired with the details of development operations (DevOps) and process automation (all, critically important in an enterprise setting) but remain focused on designing clean and streamlined analytic reports.
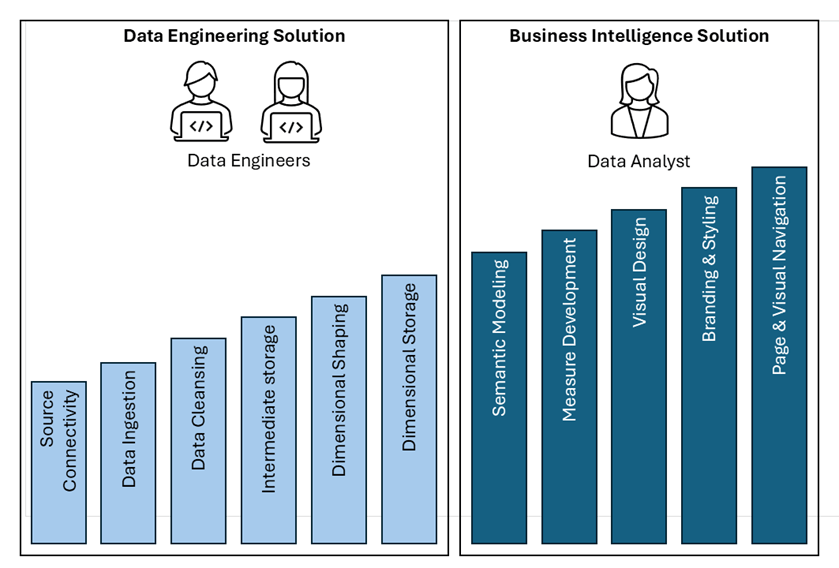
The stages of analytic report solution design are shown in the following diagram along with the roles of enterprise solution team members.
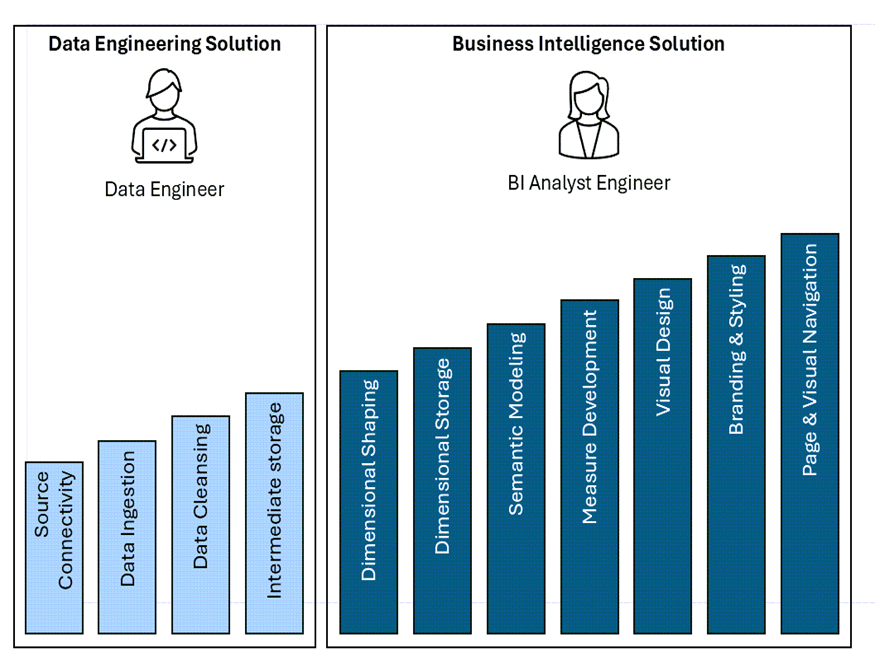
The dividing line between these responsibilities can vary. In small, less-formal projects, a Power BI Data Analyst could perform all of these activities using only the features in Power BI. The special-purpose solution would likely be suitable for a small audience with data within a smaller-scale environment. In a larger enterprise solution, the dimensional shaping and storage may be performed by an IT-managed resource with both data engineering and analytical BI skills.
Power BI uses Power Query as its built-in data transformation tool. With correct design patterns, Power BI can leverage a relational database engine to run queries to handle large data volumes and somewhat heavy workloads – but there are practical limits. Fabric shatters the glass ceiling by pushing data transformations upstream. In this diagram, data moves through a three-tiered medallion architecture used to manage ingestion, staging, transformations and incremental updates.
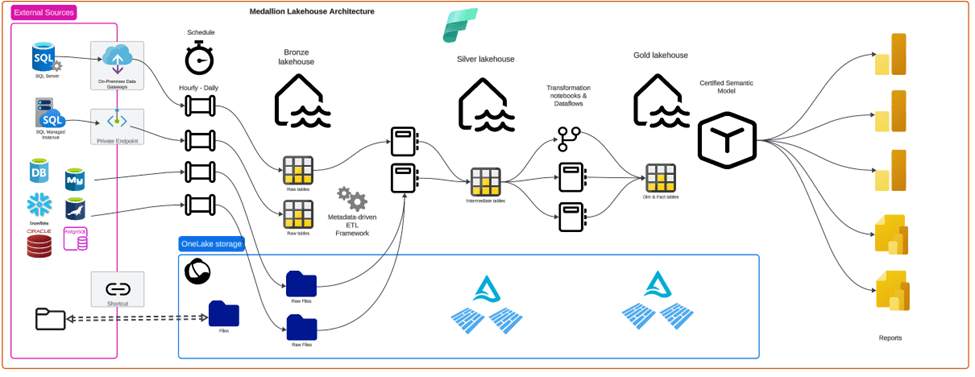
Fabric Gen2 Dataflows are the implementation of Power Query that lands resulting transformed tables in OneLake storage. Additionally, Fabric includes transformation technologies like Data Factory pipelines and Spark-based Notebooks to efficiently move data at enterprise-scale through
Most business professionals today have technical skills that didn’t exist just a few years ago. Complex tools like Power BI are easier to use and AI agents can produce code that empowers modern computer users who possess foundational skills to develop solutions much faster and easier than before. Microsoft Fabric brings enterprise-scale data tools that are assessable from any web browser. Things have indeed changed in the data and analytics industry.
The traditional data professional has a computer science degree, works in the information technology department in a company and has spent their career designing databases, writing SQL queries and designing data transformation pipelines. The new BI Analyst Engineer works in a research lab, sales, marketing or finance department and has developed some technical skills to help them do their job, using data to perform analysis and create reports for their business team. They understand how to shape and model data, and know enough SQL, Python and DAX to get the job done.
There is no one-size-fits-all solution for every organization. Some Power BI users need guardrails and restrictions and others need the freedom to create and experiment. These choices can be distilled to a few simple guidelines:
- Data governance is a necessity in any organization that requires leadership and direction to define and enforce policies. Manage expectations related to data quality, ownership and intended purpose of source data, metrics and report results.
- Plan to support solutions at each end of the spectrum of highly governed and self-service reporting, as needed within the organization.
- Define the scope and audience for each data and reporting solution. Use domains and workspaces to sandbox project and solution environments with different expectations and uses.
- Endorse data assets like semantic models and reports to manage user expectations. Promote trustworthy assets for organizational use as certified only when they are verified to meet standards for reliability, quality and scale.
Data Preparation and Data Engineering in Microsoft Fabric
Bigger data requires bigger tools. As an extension and evolution of the Power BI service, the data engineering capabilities in Fabric are more powerful and scalable than Power BI alone. Yes, Fabric includes Dataflows Gen2, which is Power Query hosted in the service but there are additional options for high-scale data movement and transformations within Fabric. Generally, Fabric pipelines and copy data jobs are most effective for data ingestion and Spark notebooks are more effective for large-scale transformations.

One thought on “Fabric Patterns: Solution Architecture & the Role of the Analyst Engineer”