My Dad and I did a lot of fishing when I was young. Back then, we fished for wild trout and steelhead in Pacific Northwest lakes and streams. If we didn’t have luck fishing in a lake or downstream from tributary rivers and streams, Dad would say “let’s go upstream where the fishing is better”.
Among all the best practices and directives for a well-architected BI solution, none stand-out as clearly as this one. Someday I hope to say something really profound that people will quote and say: “that guy must be really smart”. Such was the case when Matthew Roche from the Microsoft Customer Advisory Team posted this article to his blog, making the statement about transforming data: “Data should be transformed as far upstream as possible, and as far downstream as necessary”. The quote became known as Roche’s Maxim, now enshrined as a timeless pillar of Power BI wisdom and destined to echo through the halls of the data community for generations. Seasoned BI professionals know and practice this, and might say: “yea, yea, yea… Roche’s Maxim…whatever. I bought the T-shirt” …but this practice is often not followed by even some of those who profess to be experts. This rule is paramount and one of the first critical patterns of data architecture. If it is so important, why doesn’t everyone follow this advice? I see Power BI and data projects all the time that do not follow this simple directive.
In a Power BI solution, there are two different ways to think about applying the “upstream transformation” rule:
- Design queries in Power BI/Power Query that direct the data source to perform query processing at the source.
- Move transformation logic out of Power BI to an earlier stage in the solution architecture.
The first technique works best with compatible data sources, such as relational database systems like SQL Server and Oracle. When queries are written efficiently, Power Query can perform query folding and push the query processing upstream to the database engine. Although there are a few nuances to implementing query folding, the essential guidelines include:
- Never ever ever ever start a query in Power Query with a hand-written SQL statement. Either reference a table or view directly in Power Query.
- If a table join or heavy query logic is needed, create a view in the database and reference it Power Query.
- Perform “foldable” steps first and try to avoid steps that break query folding, checking the steps to ensure that the designer allows you to view the native query.
- Consolidate steps like renaming columns or changing data types into a single step.
- If transformation steps that break query folding are necessary, perform those steps last.
As with any data project, understanding the requirements and long-term objectives is important before we get started. Power Query has over 200 different data connectors and can import data from thousands of different data sources. Some of these data source providers can process queries at the source, within a database engine or query processing service. However, this is not the case when importing data from files that sit in a file share, folder or storage container. The difference will be apparent when comparing importing data from a large set of files and importing data from a managed database server.
Fabric Data Factory, Pipelines, Notebooks and Dataflows
Fabric projects and solutions support multiple data transformation tools. The best transformation tool choice depends on the scale, scope and skills of the developers who create the solution and those who will support it down the road. There is a lot of “it depends” to making the best choice but I’ll boil it down to a few simple guidelines.
Dataflows Gen2 are the implementation of Power Query in the Fabric cloud service. For scalability, dataflows are a step-up from query logic buried in each Power BI semantic model and can be an effective way to consolidate and centralize transformation logic for relatively small and uncomplicated transformations. However, dataflows do run out of steam at a certain size and scale, and enterprise-class data solutions are typically easier to manage if you use pipelines and notebooks. I have bullishly used dataflows in client projects and then seen them fail in production. Unlike Power BI Desktop, dataflows lack step-by-step debugging tools or ability to view row counts and progress while they run. They either succeed or fail, so troubleshooting is cumbersome. For limited-scale, self-service data transformations, moving from Power Query in Power BI Desktop is a good step for BI developers. If you have Python chops, consider learning to use notebooks. I didn’t when I started using Fabric but have become a notebook advocate. early in my journey, I learned to use Python dataframes and notebook code by asking an AI assistant to translate M code into PySpark with reasonable accuracy.
In my experience, serious data engineers and data architects use pipelines and notebooks. Why? Data Factory pipelines are an effective way to orchestrate multiple tasks and activities, and you can view the progress for each step and stage of the pipeline as they run. They can be scheduled, logged and monitored far more easily than dataflows. Likewise, Spark notebooks show the progress of each code cell and stage of the progress as they run. Because notebooks use compiled Java libraries and Python Spark “PySpark” code, you can monitor each stage and easily debug and troubleshoot transformations as you develop and run code. For Power BI professionals, there is a learning curve, but notebooks and Python have tremendous opensource community support. Most developers depend on AI-assistant tools like Copilot to generate initial code and to help with debugging. Just be careful to use AI tools to assist and support rather than writing code that you don’t know how to maintain.
Which methods process data faster? It depends. PySpark notebooks are fast because properly-written code runs efficiently on distributed Spark clusters. This is typically the go-to solution for heavy transformation workloads. High-volume copy activities can actually run faster in a pipeline because the service doesn’t need to spin-up compute resources. the new Copy Job item, which is a simplified and streamlined Fabric object based on the pipeline framework, can be even faster. Large pipeline orchestrations can use variable libraries and parameters to orchestrate metadata-driven frameworks and multiple environment deployments.
In November 2024, I compared data processing performance between each of these options and shared the results in this post: Comparing query design efficiencies in Power BI, with text files, lakehouse & database tables.
So, if you are working with small to moderate scale data, you prefer to use Power BI native tools, and you don’t need to build an enterprise-scale ETL process, Dataflows Gen2 is a good solution when used efficiently.
Dataflows Gen2 and Power Query
Fabric introduced Dataflows Gen2, an implementation of Power Query that resides in the Power BI/Fabric cloud service. A dataflow works exactly the same way as Power Query in Power BI Desktop except the entire development and connection experience takes place in a browser-based query designer. Rather than outputting to a table in an Import-mode semantic model, dataflow queries can output to OneLake storage objects like a Lakehouse, Warehouse or SQL Database; enabling data to be staged and moved through a data architecture. This is an effective way to utilize Direct Lake semantic models with compressed data residing in native Delta-Parquette storage rather than Import mode and doesn’t require models to be processed and refreshed. The Dataflows Gen2 design interface is an improvement over Power BI Desktop, which will likely be updated as well.
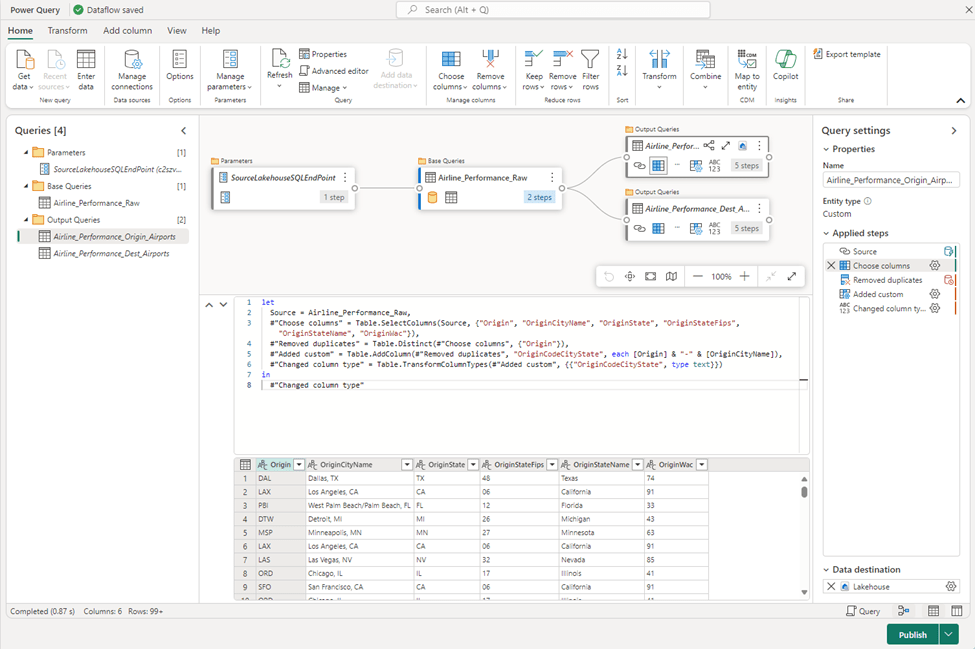
The changes are not drastic so this will be an easy transition for experienced users. There are several improvements that include a new diagram view of dependent queries, iconized steps. One of my favorite improvements is the advanced script editor pane.
The Importance of Query Folding
When working with enterprise data, query folding is one of the most important features to understand and utilize, particularly with large quantities of data. Query folding in Power Query refers to the process of translating Power Query transformations into a native query that the data source can execute. This allows Power Query to push as much of the data processing workload as possible to the data source, rather than performing all transformations on the local machine (or wherever Power Query is running). Power Query is an impressive little query engine with a comprehensive library of transformation classes and “M” language functions (I will discuss the M language in more detail later in this chapter, in the section: “M” Code Basics). However, it is not a particularly scalable technology when compared to large database platforms and high-scale processing engines like Spark and SQL Server. It is, however, capable of delegating certain query instructions to a compatible database engine.
Ensuring that queries are being folded back to the data source is not an absolute must in all cases. It is, however, a critical consideration and a best practice when working with large volumes of data at-scale and should be implemented when using any foldable data source, like a relational database. In addition to traditional, on-prem database system, query folding also applies to Fabric Warehouse, SQL Database for Fabric and the SQL Analytics endpoint for a Fabric Lakehouse.
Bottom line
- If you are using Fabric Dataflows Gen2 or Power BI Desktop, make sure your queries fold.
- If you need to transform data at-scale, learn to write PySpark in Fabric notebooks. It’s not that scary and AI helps.
- If you need to orchestrate transformations or ingest data without transformations, use Fabric Data Factory pipelines and Copy Job activities.
