
When Power BI was released in 2015, many industry professionals recognized that at first it was a significant departure from their previous product focus that addressed the needs of IT developers and database professionals. Microsoft product teams had previously made deep investments in enterprise-ready technologies that eventually comprised all the capabilities within Power BI; namely to connect to, transform, store, model, calculate and visualize business data. But, projects were developed using IT developer tools like Visual Studio and SQL Server Management Studio.
As self-service analytics and business intelligence reporting tools became popular, Microsoft adapted these technologies with the focus on ease-of-use for the desktop user. At first, competitors pushed the industry forward with impressive visualization features which quickly caught the attention of business data users and new products rose in popularity, but Microsoft had an edge; they had already developed data storage and data management technologies that were up to the task to handle large quantities of data at-scale. Within a few short years, Power BI evolved to serve the needs of two audiences – desktop data analysts and professional IT data professionals.
Power BI, along with Microsoft Fabric now lead the industry in both categories, and many in-between. If you work for a large company, you will recognize some familiar themes. If you are preparing for a career as a Data Analyst, Data Engineer or BI Analytics Engineer, this may help you understand the road ahead, and some of the challenges you will face in that journey.
Business Intelligence Solution Architecture
The term “architecture” is more commonly used in the realm of data engineering and data warehouse project work, but the concept applies to BI and analytic reporting projects of all sizes.
Like the architecture of a building, a complete Business Intelligence architecture contains the foundation and structure of your solution. Using the building analogy, a data platform can take on many forms, like a single-story cottage, a sprawling university campus or a towering skyscraper. For the data platform, the foundation is the selection of source data that are shaped, cleansed and transformed for reporting and analysis.

The building analogy continues to apply when we think about working with data at scale. Let’s compare a New York skyscraper to a suburban college campus. If the volume and variety of building occupants are known ahead of time, we can plan, design and construct an 80-floor office building on a solid foundation. To some degree, floor layouts can be adapted for a variety or tenants in the future, but the foundation and core infrastructure are relatively fixed. Likewise, a data platform with well-defined business and technical requirements can be constructed on a database or data warehouse architecture. Think about a college campus in a suburban community. Most colleges or universities acquire large parcels of land at relatively low real estate cost, and then build and expand when funding becomes available. Limited only by available infrastructure (like power, utilities and streets), if buildings are too small, they can be bulldozed and replaced with higher-capacity buildings. As the university expands and evolves over time, the eventual net cost over time is likely to be more than the skyscraper that required a high initial investment.
A solution architecture is the same. If you have all the requirements and the funding up-front, you can build a large solution on a fixed scale. However, making significant changes or expanding beyond the initial scale will be expensive, if at all possible. Taking the college campus route, you can start small and expand as you go as long as the infrastructure is in-place, and you are willing to tear-down and rebuild when necessary. Foundational planning is essential but to some degree, rebuilding and expanding scope is inevitable.
Understanding the Three V’s of Data
Power BI is an amazing collection of data technologies, but one product can only handle so much data before it requires a division of tools and separate processes. Understanding “the three V’s of data” helps to explain the dynamics of data and what is necessary to meet scaling requirements.

The three V’s are defined as follows:
Volume refers to the amount of data generated at the source and stored within the data platform. Volume is often measured in the number of records or rows of data needed to represent details, historical facts and dimensional values.
Velocity describes the speed at which data is generated, processed, and analyzed. This can include both transactional records that are recorded for later retrieval or real-time data streams. Real-time streams might include data emitted from IoT device sensors or social media posts that require rapid processing. Other examples include transactions generated by a point-of-sale (POS) system or records being updated in a customer relationship management (CRM) system.
Variety describes the different types and formats of data. Examples include structured data from databases, semi-structured data in file formats such as JSON and XML, and unstructured data like text documents, images, and video files.
In the past, a data warehouse provided central storage for all business data, optimized for business reporting. Data marts were a subset of dimensional data reserved for reporting, related to a business subject area.
As the modern data warehouse has evolved to embrace scalable and inexpensive cloud storage technologies, the data lake has largely replaced the relational database for this purpose. This is primarily because data warehouses and data marts are used mainly to house large volumes of read-only data, with less emphasis on transactional consistency that can be managed with data pipelines and transformation tools. Data lake eco systems now provide capabilities that address volume – the ability to store massive amounts of data in cloud storage, velocity – scaled-out, parallel processing engines that can handle event streams and parallel batch loads, and variety – data files and atypical data structures lacking constraints.
Power BI and Microsoft Fabric
Power BI is a world-class reporting platform, but it had humble beginnings as early as 2010. Power Query, Power Pivot and Power View, the early components of Power BI, were first introduced as Excel add-ins before it was released as a stand-alone product. The Power BI cloud-based service replaced OneDrive and SharePoint Online as the hosting environment for shared reports and semantic data models. The Power BI service quickly grew to accommodate the needs of large organizations with huge volumes of data and many thousands of users.
As the Microsoft modern data platform expanded from Azure Data Lake storage and Synapse Analytics, the next generation of tools and services needed a capable platform and management interface, and the Power BI service was the right fit.
Microsoft Fabric, known initially as “Project Trident”, was a retrofit of the Power BI service, expanded to accommodate a diverse set of data workloads. To accomplish this feat, several product teams were united to meet these core objectives:
- Unify end-to-end data engineering, storage, query and analytics development and usability into a single browser-based experience.
- Offer turn-key software-as-a-service (SaaS) platform, accessible to small, medium-sized and enterprise-class organizations.
- Optimize and simplify Azure Datalake storage to manage data and files securely in one place.
- Standardize a single open-source data storage format for all workloads.
- Embrace Apache Spark as a first-class data processing engine (later to be displaced with an optimized Microsoft-developed Spark engine).
- Integrate SQL Server/massive parallel-processing (MPP) data warehouse query engine.
- Consolidate all costs into capacity-based monthly, annual or pay-as-you-go subscriptions.
Building BI solutions on Modern Data Architecture
One of the key advantages of using a suite of data tools with enterprise-scale data is the ability to store the results of one process before moving to the next stage. This is probably the greatest difference between using a single tool like Power BI or taking a coordinated approach to separate data engineering development from data analysis. As source data increases in volume and complexity, it is often necessary to store data in a dimensional structure before designing semantic data models. The key to reducing overall cost and effort is to use a common platform and tools that were designed to work together.
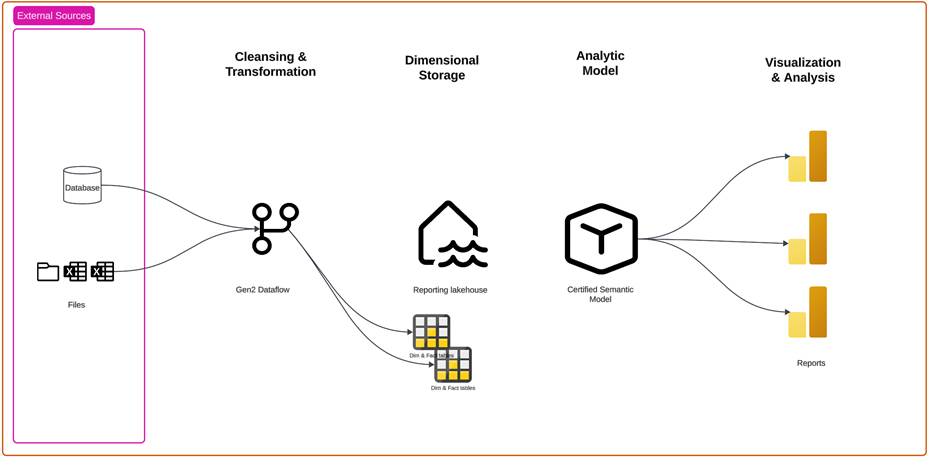
The essential components of a data platform architecture are fundamentally the same regardless of scale, but the details can change depending on the complexity of the data environment. Here is an example of a simple BI data platform architecture, depicting external data sources, data extract, transform and load (ETL) layers, dimensional storage, and an analytic model to support visual reporting and analysis.
The next architectural diagram demonstrates how the modern data platform may be expanded and scaled to meet the requirements of a large enterprise business intelligence solution. The point is not to overcomplicate the process but to tame complex data transformation challenges and address requirements of data volume, velocity and variety.
In this example not only are there several different types of data sources but some have challenging connectivity and security requirements, necessitating an on-premises data gateway and support for private endpoints. Rather than copying large volumes of file-based data, shortcuts are used to virtualize the source container to eliminate duplication. Shortcut data is read from a single copy of the source files only when needed to ingest into the analytic solution.
This diagram depicts a medallion data architecture, which is a common approach for moving and storing data at various stages of data ingestion, transformation and shaping processes. Patterns like the medallion architecture can be applied to address the challenges of expanding data volume, velocity and variety.
The bronze layer ingests data from various sources into a single storage location (in this example, a Fabric lakehouse).
In the silver layer, data is cleansed to improve data quality, filtered and de-duplicated. Schemas may be applied to provide context and structure.
Data in the gold layer is curated to meet specific business use cases and provides high-quality results for reporting and analysis.

No More Throwing Projects Over the Wall
Over the years, business intelligence and conventional database project development encompassed different disciplines and approaches. To confuse matters, the differences can be both stark and subtle in different ways.
BI and analytical reporting projects are often created by business professionals who are more focused on business function rather than software development. Database and data warehouse developers typically work from a specific set of requirements and adhere to rigid design standards. Databases were typically designed to be used by application developers who would in-turn create user-friendly interfaces for business consumers. With a technical audience in mind, data structures, table and field names are often cryptic, suited for the software developer but confusing for non-technical users. Conversely, BI semantic models are typically designed to be easy for business users to comprehend and navigate as they explore data or create ad hoc reports.
This dichotomy often created an “over the wall” situation, where the data engineering and database assets are created by one team of developers and the BI assets are created by a completely different person or team who have different goals and perspectives. And they often didn’t “speak the same language” – meaning that they work and communicate in a different business context.
Analytic reporting efforts often begin as informal projects that evolve and expand with the pace of business, which is challenging when the foundational data structures are rigid. When the data engineering and business intelligence team work iteratively, within a common platform, they can adapt and make adjustments as they go. In less-formal projects, the entire process may be conducted by the same person. But larger solutions require coordination among teams and team members, using different tools and methods. The following four scenarios include the same activities that are performed by professionals in different roles. Each activity is a step in the process to acquire, shape and prepare data for analytic reporting.
Isolated Power BI Projects
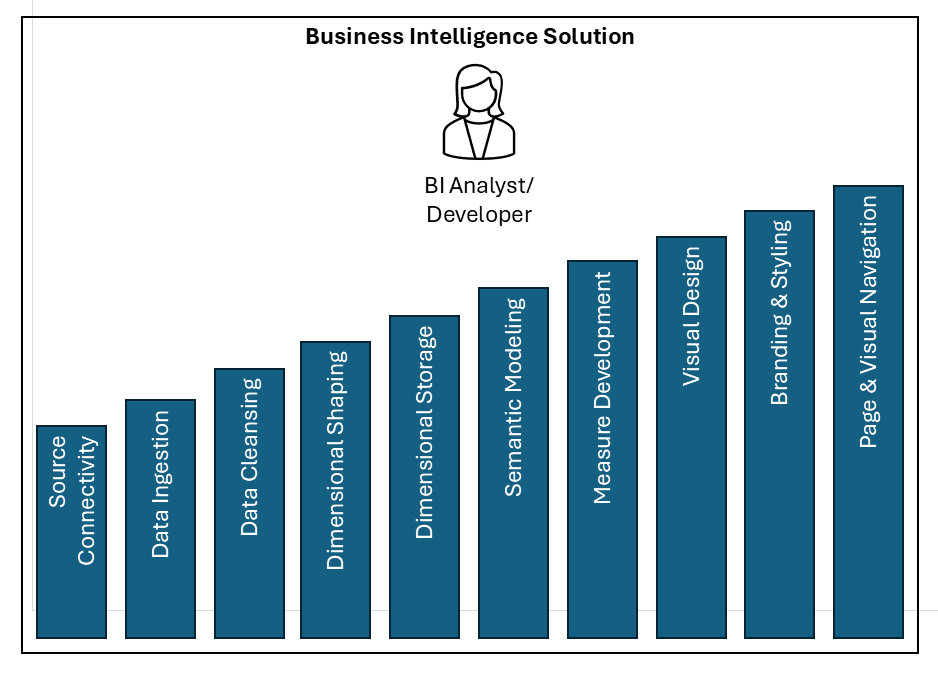
This first scenario describes all the steps in a typical Power BI solution. Arguably some of these steps are simple and require little effort on behalf of the BI Analyst / Developer. Nonetheless, every project includes each of these steps. Using only the features of Power BI Desktop, you connect, ingest, cleanse, shape, model, create measures and visualize data in a functional and attractive report. One person does all the work, and the process is relatively uncomplicated, following steps to create a conventional Power BI model and report.
Pros and Cons:
Where to Draw the Line Between Data Engineering & BI
Using only Power BI to manage the entire process is simple and affords the BI Analyst freedom and flexibility. However, isolated BI solutions promote duplication and data sprawl, without central governance and control. Each solution is self-contained and may not scale to support high data volumes or a variety of data sources. Following are three scenarios that delineate the enterprise database and data engineering effort from business intelligence and analytics development.
Conventional Data Warehouse and Power BI Solutions
The conventional data warehouse and Power BI scenario has a clear division of labor and management. Data engineers perform data cleansing and shaping using ETL tools and store the resulting data in a data warehouse or data mart. From there, it is up to the Data analyst to use Power BI to create a semantic model, measures, visuals and reports. The business intelligence professional in this scenario must understand semantic model design and possess skills with DAX, to perform calculations to support report designs.
Pros and Cons:
This common approach is a logical delineation of disciplines and skills between database professionals and business-focused data analysts which is often a good fit when these two teams can work together to resolve dependencies between the dimensional storage layer and semantic model.
However, if the dimensional storage (data warehouse and/or data mart) design is cast in stone and changes cannot be made to accommodate new semantic model requirements, the data analyst is left to devise creative workarounds and develop solutions out of process. A common mitigation technique is to create database views to present business-specific query results and perform lightweight calculations. This works when views are not overly complicated and when table structures support reporting requirements.

Common risks are that the data engineering team may not be available when changes are needed to accommodate semantic model development. More than a few times in my career I have seen scenarios where contracted developers or consultants or were brought in to create the data warehouse and then were later unavailable to support BI model design efforts. The “wall” between the data engineering solution and business intelligence solution is a classic challenge. Communication barriers emerge when teams are unfamiliar with each other and don’t communicate using common technical or business terminology, creating an “us vs them” situation. This challenge is not insurmountable and can be resolved by ensuring clear and frequent communication on the foundation of a cooperative team business culture.
One example of the possible disconnection between data engineering and business intelligence design efforts is when the data engineer is asked to create a view to support a reporting requirement such as “sales profit by month”, so they group and aggregate sales data by month and perform the profit calculation in the SQL query that the BI developer uses to populate the semantic model. The BI developer can no longer show results below the month level and cannot discern values for costs and gross income.
Enterprise BI and Self-service Reporting
The next scenario takes the IT-led effort to the next level with semantic model development in the data engineering camp. This approach employs a multidisciplinary data engineering team who have semantic modeling and DAX measure calculation skills. This data architecture was very common before citizen-developed BI became popular and IT developers did all the technical design work. Report creators are trained to use Power BI purely for report creation, using certified semantic models. In theory, report design is just a matter of connecting to a deployed semantic model and then dragging and dropping fields and measures into the report design canvas to create report visuals.
Pros and Cons:
Report creators need few technical skills to create their own reports. The data engineering and professional BI team are entirely responsible for creating, managing and enhancing semantic models to serve business reporting needs. This approach affords the business report creator very little freedom to make enhancements since they must depend on the technical team to make enhancements when new business requirements emerge.

This architecture is all well and good if it meets users’ needs. This approach works when reporting requirements are well-defined and don’t change frequently, but it limits flexibility and may result in deploying many models and reports, each only for a specific purpose. If business users have the desire and capacity to transform and model their own data, they are likely to create their own solutions and work outside of process. In my experience, this often leads to the proliferation of unsupported personal and small team reporting projects based on disparate data sources that can result in different reports presenting multiple versions of the truth. Such results erode confidence and raise questions.
Introducing the Analyst Engineer
Most business professionals today have technical skills that didn’t exist just a few years ago. Complex tools like Power BI are easier to use and AI agents can produce code that empowers modern computer users who possess foundational skills to develop solutions much faster and easier than before. Microsoft Fabric brings enterprise-scale data tools that are assessable from any web browser. Things have indeed changed in the data and analytics industry.
The traditional data professional has a computer science degree, works in the information technology department in a company and has spent their career designing databases, writing SQL queries and designing data transformation pipelines. The new BI Analyst Engineer works in a research lab, sales, marketing or finance department and has developed some technical skills to help them do their job, using data to perform analysis and create reports for their business team. They understand how to shape and model data, and know enough SQL, Python and DAX to get the job done.
Data engineers in the IT team build pipelines to extract data from secured line-of-business data sources. They create data transformations to clean and prepare data stored in a lakehouse or data warehouse, intermediate storage, where it can be used by data analysts and engineers for their own business purposes. The Analyst Engineer uses curated data from intermediate storage to shape and model it for their own business needs, which may include creating machine learning models and analytic reports.
Pros and Cons:
Although the Analyst Engineer has the technical skills to perform their own data preparation and modeling, they are not focused on holistic data governance and organizational data quality. In most organizations, this category of self-service analytics must be managed to a different standard than data certified for organization-wide consumption. Certain business domains can manage their own data for their own purposes, but that should not supersede strict, organization-wide data governance policies and enterprise standards. Use workspaces to contain and isolate business-specific data solutions and manage expectations accordingly.

There is no one-size-fits-all solution for every organization. Some Power BI users need guardrails and restrictions and others need the freedom to create and experiment. These choices can be distilled to a few simple guidelines:
- Data governance is a necessity in any organization that requires leadership and direction to define and enforce policies. Manage expectations related to data quality, ownership and intended purpose of source data, metrics and report results.
- Plan to support solutions at each end of the spectrum of highly governed and self-service reporting, as needed within the organization.
- Define the scope and audience for each data and reporting solution.
- Endorse data assets like semantic models and reports to manage user expectations. Promote trustworthy assets for organizational use as certified only when they are verified to meet standards for reliability, quality and scale.
- Use domains and workspaces to sandbox project and solution environments with different expectations and uses. Designate workspaces to contain certified and non-certified reports and models. Set clear expectations for artifacts, such as “certified of organizational use” and “business created, use at your own risk”.
- Conduct reviews to reduce sprawl and reduce duplication by rebuilding citizen-developed assets and promote uncertified models and reports to certified quality assets.
