— report recipe
also see: Drillthrough from Paginated Report to Power BI
Navigating from a Power BI report to an SSRS Paginated report with filters and parameters.
| Product Versions SSRS/Paginated Reports (one of the following): – SQL Server Reporting Services 2016 or newer – Power BI Report Server – Paginated Reports in the Power BI service Power BI Desktop: – Power BI Desktop May 2019 or newer All versions of Reporting Services accept parameters in a similar fashion, but subtle changes were made to URL parameter formats in SSRS 2016. Some adjustments may be required if you want to apply these techniques to SSRS versions prior to 2016. |
| What You’ll Need – A Power BI report connected to a data source using import, DirectQuery or SSAS direct connect mode. Report server: – Power BI Report Server or a Power BI subscription with Premium capacity (minimum: P1 or A4) – Moderate level DAX coding skills |
| Difficulty level: 200 |
Designing the Power BI Report
This recipe primarily involves Power BI report design techniques. I’m not going to get into the details of Power BI report design but will cover the basics with a partially-completed report to get you started. If you are less-experienced with Power BI you can use this as an example for future report projects.
The sample database and files will be available in the forthcoming book: SQL Server Reporting Services Paginated Report Recipes, 2nd Edition (working title).
These instructions are provided as an example but refer to files that will be available when the book is published. Please contact me in the comments with questions and feedback.
Solution
Figure 1 shows the Sales Summary Power BI report, which is deployed to my local Power BI Report Server along with the Sales Detail, a paginated (SSRS) report also deployed to my local Power BI Report Server.

Figure 1
We will start by looking at the target report. This is just a standard SSRS paginated report. A completed copy of this is provided for you to configure and deploy to your report server or Premium Power BI service tenant. The sample report is very simple and could easily be enhanced to include more information in greater detail.
1. Open the Sales Detail.rdl report in Report Builder
There are four report parameters in this report, two of which are used to connect to the SQL Server database. The other two parameters are used to pass filter values to the underlying query.
2. Edit the ServerName parameter and set the Default property to the name of your server or instance
The default value for this parameter LocalHost which connected to my local default instance of SQL Server. You can leave this setting if your SQL Server instance is the same as mine.
3. Close and save any changes the ServerName parameter
4. Preview the report and make sure it connects and displays data from the sample database
5. Select different values for the Year and Country parameters using the parameter dropdown lists and click the View Report button to see values in the report change, and to confirm that the parameters are working correctly.
6. Use the Save As… option on the File menu to save the report to a folder on your report server or a workspace in your Premium Power BI tenant
Note: Depending on the Report Builder menu option and deployment target, the terms “save” and “publish” are used interchangeably, meaning that the report has been deployed to a server or service where it can be ran and viewed by users.
Get the address for the published paginated report
1. Open Notepad or your favorite text editor
2. In a web browser, enter the address for your report portal or Power BI portal where you published the Sales Detail paginated report
Tip: If you don’t know the address for your web portal or report server, you can use Report Server Configuration Manager to lookup the Web Service URL and Web Portal URL. By default, the web portal address is http://SERVERNAME/Reports and the report server address is http://SERVERNAME/ReportServer (where SERVERNAME is the name of the server where Reporting Services is installed) but this is configurable and might be different in your environment.
3. Navigate to the folder or workspace and run the newly published report, verify that the report runs and returns data
4. Use Ctrl-C to copy the full address for the report from the browser address bar to the Windows clipboard
5. Paste the address into the text editor
The next step can seem a little tricky but it’s not really complicated. You need to get the path to the report on the report server rather than the report portal.
If you published the paginated report to your on-premises report server, do the following:
1. In your text editor, copy and paste the report address to a new line
2. In the new address line, locate the text “Reports” and change it to “ReportServer”
3. Copy the modified address line to the address bar in your browser and press Enter
The browser should navigate to a text menu page similar to Figure 2.
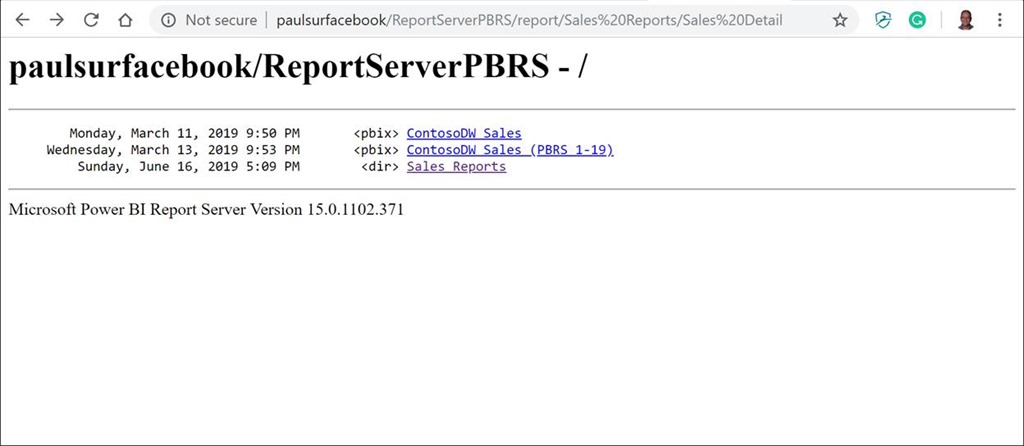
Figure 2
The address for the report is actually not yet in the correct format but it was sufficient to navigate to the Home folder on the report server. The following steps are used to obtain the correctly-formatted report address.
1. Use the links displayed on the report server menu page to navigate to the folder to which you published the Sales Detail report and click the report name link to run the report
2. When the report is displayed, copy the complete address from the address bar and paste it to a new line in your text editor
This is the correct path for this report on the report server. You can new add parameter values to the end of the address.
3. Append parameters and values to the address in the address bar like this. Each parameter is preceded with an ampersand character:
&Year=2018&Country=Canada
4. Press Enter and verify that the parameter is changed in the report
Open the starting report in Power BI Desktop and add drillthrough navigation for the paginated report
1. Make a copy of the Sales Summary-Starter.pbix file and rename it Sales Summary.pbix
2. Open Sales Summary.pbix in Power BI Desktop
If you will be using Power BI Report Server to deploy report on premises, make sure that you use the version of Power BI Desktop designed for your server version. If in doubt, you can download and install Desktop from the download menu in your report web portal.
3. On the Home ribbon, click the Edit Query button to open the Power Query editor
4. You will see three query parameters. Two parameters are used to manage database connection information in a similar manner to the Sales detail paginated report.
Tip: Using parameters in the Power Query editor can help manage variable information like connection information, file paths and addresses.
In the starter report file, there are three text type query parameters. Modify these parameters, using the following instructions:
| Parameter Name | Description |
| ServerName | SQL Server address or server name. You can use “LocalHost” if it is a local instance. |
| DatabaseName | SSRS2019Recipes |
| ReportURL | Path to the deployed SSRS/paginated report |
5. If necessary, change the ServerName parameter current value to connect to your SQL Server
6. Copy the report server address for the deployed Sales Detail report from your text editor and past it into the current value ReportURL parameter.
Build the dynamic target report address link as a measure in Power BI
The ReportURL Parameter value is exposed as a column in a table named Constants. You will use this to build a dynamic link in the report.
1. On the Home ribbon in the Power Query editor, click Close & Apply to process queries and return to the report designer.
2. Figure 3 shows the report designer in Power BI Desktop. The objective is to add links to each item displayed in the table visual, allowing a user to see a paginated report with details related to a selected year and country.
3. Expand the Sales Summary Subcategory Country table in the field list on the right

Figure 3
4. Click the ellipsis (…) to the right of table name to see the context menu and select New Measure
5. The formula bar is displayed above the report canvas with placeholder text: Measure =
Note: You can use the down arrow on the right side of the formula bar to expand the formula editor window, and the up arrow in the same location to collapse the formula editor
6. Replace the placeholder text with the following new measure:
Detail Report Link =
VAR SelectedYear = SELECTEDVALUE( 'Sales Summary Subcategory Country'[Year] )
VAR SelectedCountry = SELECTEDVALUE( 'Sales Summary Subcategory Country'[Country] )
VAR RptURL = SELECTEDVALUE( 'Constants'[Report URL] )

RETURN
RptURL & "&Year=" & FORMAT( SelectedYear, "0000") & "&Country=" & SelectedCountry
The purpose of this measure is to build the address text used for our link to the detail paginated report. The SelectedYear and SelectedCountry variables get those respective values. The RptURL variable gets the report path the parameter. This DAX script assembles the URL in the appropriate format.
As you enter the text, use the Intellisense and autocompletion features offered by the editor to build the DAX code. These features can help with proper code syntax and save you from typing errors.
7. Press Enter to validate the code and save the measure
8. With the measure selected in the field list on the right, switch to the Modeling ribbon
9. Use the Data Category drop-down to select Web URL (see Figure 4)

Figure 4
Add report links to the report
With the Detail Report Link measure added to the data model and categorized as a web URL, you can add a link to the table that will dynamically generate a context-specific link for report navigation.
1. Before you go any further, click the floppy disk icon on the toolbar to save your work
2. Select the table on the right side of the report canvas that shows sales by product category grouped by years
3. Drag the new Detail Report Link measure from the field list to the Values field well below the SalesAmount field. This adds a new column to the table visual showing a long URL in blue “link” text (see Figure 5)
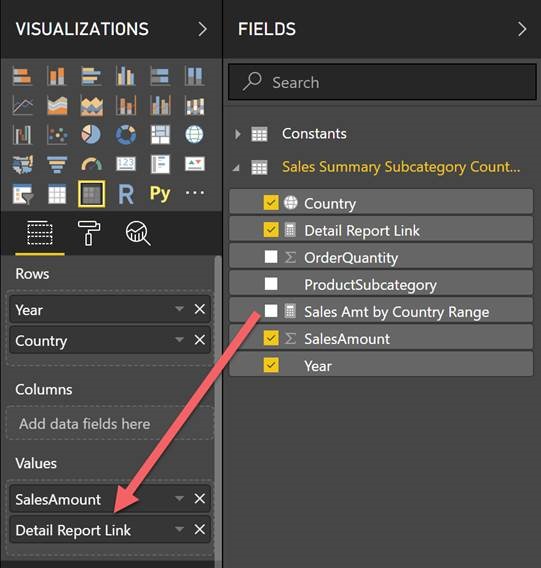
Figure 5
Tip: It is easy to deselect a visual so before you begin changing properties, make sure that you still have the table visual in the report canvas
4. In the left-most blade in the panel to the right of the report canvas, click the paint roller icon to see the properties for the table visual, shown in Figure 6
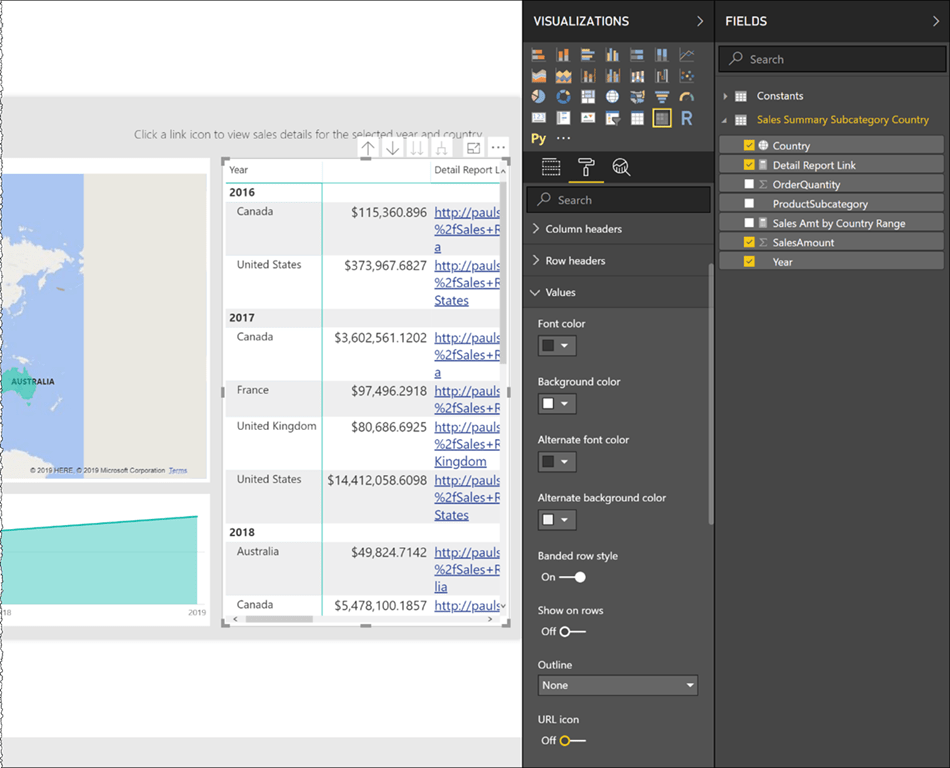
Figure 6
5. Expand the Values group
6. Locate the URL icon property and switch the state of the property to On
7. Verify that the web addresses displayed in the last column of the table are replaced with a small blue link icon, which you can see in Figure 7
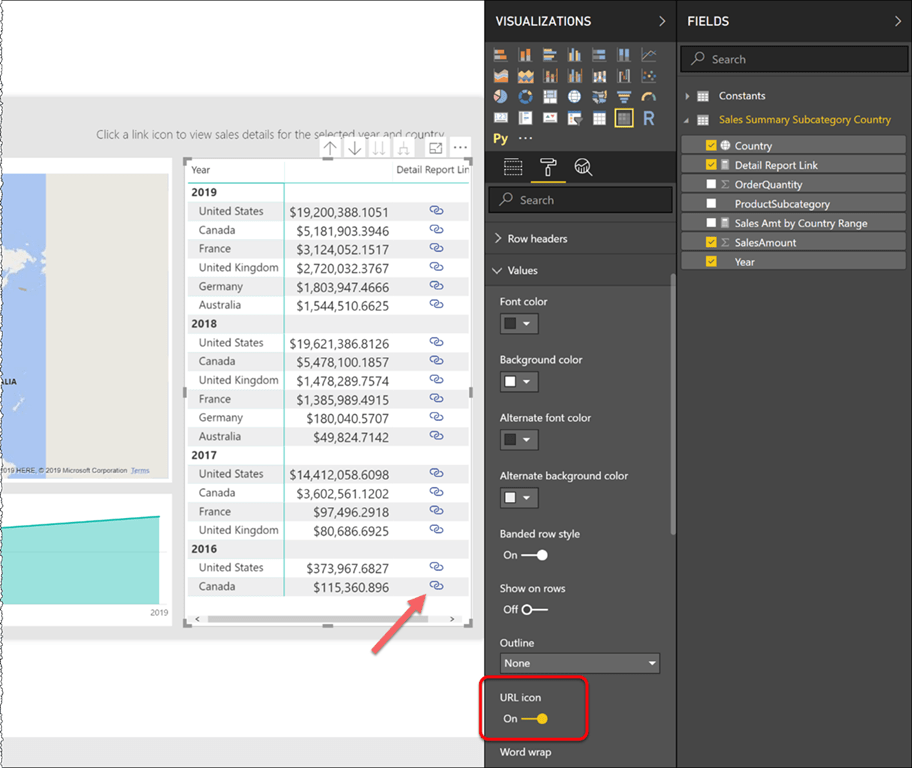
Figure 7
Test and publish the completed report solution
A this point, navigation should work from the report in Power BI Desktop, just as it should after the report is deployed.
1. Hover over the link icon on a few different rows to see the parameters at the end of the address in the tooltip
2. Test the report navigation by clicking a link after noting the corresponding year and country.
3. Publish or save the paginated report to your report server or Premium Power BI tenant
4. Test drillthrough navigation in the deployed reports
5. Navigate to the deployed copy of the Power BI report
6. Locate a row with values for a specific year and country and click the corresponding link
The paginated report opens in the browser
7. Verify that the paginated report parameters reflect the selected year and country

Figure 8
Final Thoughts
Report navigation is the essence of data exploration and gives users the ability to understand their data in proper context. Dashboard and summary reports help business users see the big picture but having access to details let’s them understand the low-level details behind the numbers. Power BI as an ideal tool for summary-level, interactive reporting and paginated reports are great for consuming detail-level data. Using this technique allows you to have both of these capabilities. Power BI reports can be published to your on-premises Power BI Report Server or to the cloud Power BI service. Paginated reports do not have to be in the same location and can be deployed on-prem in a standard SSRS report server, Power BI Report Server or in you Premium Capacity Power BI Service tenant.
A couple of things to keep in-mind when using this technique are that there are string size limits when passing parameters in a web URL. You should avoid passing sensitive information in clear text parameters. When navigating between reports located on different services or services, users may be prompted for their credentials to login to a service.


Hi could you send my the files please..
Hello Paul, I am trying to make it work with a PBIX App having hyperlinks to a parameterized RDL report. Both of these reports have been published on the same on-Premise Power BI Report Server.
On the PBIX App, I have a table visual with say 10 rows, first column being Country and last column being the hyperlink to RDL report having the values of Country as the parameter value for RDL report. But this setup is not working for the following two reasons:
1. As the RDL report is rendered, it does not automatically select a parameter value for Country (facilitated by a drop-down of 10 values)
2. Go action is not working so the actual report is not rendered until I press View Report button on the Report Taskbar.
Would you please confirm that your setup has RDL report published to a SSRS Reporting Service Portal and not a Power BI Report Server Portal or Power BI Service?
I think the setup I am trying to work is not supported for RDL reports published to on-Premise PBIRS even in January 2021 Release.
How these linked reports will behave in embedded code , because on Web URL navigation will be passed to power bi service rather than showing the reports in
external web application . is it possible to show the linked paginated report in web application itself
I don’t think you could do this within the report itself because the redirection would need to be managed by the container app. Maybe you could build a URL that posts a request to the app responds with a new URL to render the target report. This is outside my area of expertise but a creative application developer could probably orchestrate something like this.
It would be great if you can make video of this steps and publish in YouTube. Thanks.
Hi,
Thank you for this article. Is it possible to drill through from a power bi report on the power bi service to a paginated report also on the power bi service?
Thank you
It wasn’t possible the last time I checked it…
Works fine in the Power BI Service for me now
Reblogged this on MS Excel | Power Pivot | DAX | SSIS |SQL.
Microsoft release so many good things for Power BI – so I hesitate to say it – but I just can’t see the advantage of Paginated reports.