
The use cases for Power BI, along with its many companion technologies, are numerous. Many organizations are exploring the use of Power BI in enterprise-scale solutions and struggling with the myriad of options and choices. I’ve grouped these options into nine categories that I call the “Nine Realms of Power BI”. Along with my friends at CSG Pro – Brian, Greg & Ron, we have created a Power BI-based tool that you can use as a sort-of survey to assess your business and technical requirements and then recommend a reference solution architecture in one of these categories. The options, components and reference architectures, capabilities, limits and cost guidelines are detailed later in this presentation. I’ll also take you on a tour of the solution advisor tool, which I have published for public Internet users.
This is a presentation I prepared for the Redmond SQL Saturday in Feb 2018 and have since presented at several SQL Saturdays and user groups. Before you make any business decisions or big investments based on the information in this post, please keep in mind that this information was current at that time. The Power BI platform continues to evolve and capabilities have been added; particularly related to enterprise scale, development and capacity in Premium capacity*.
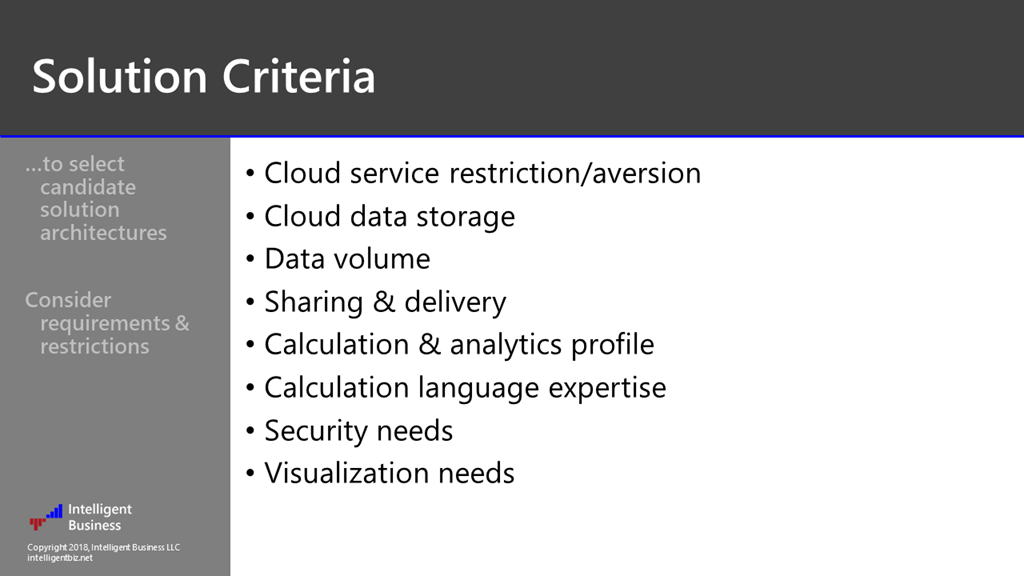
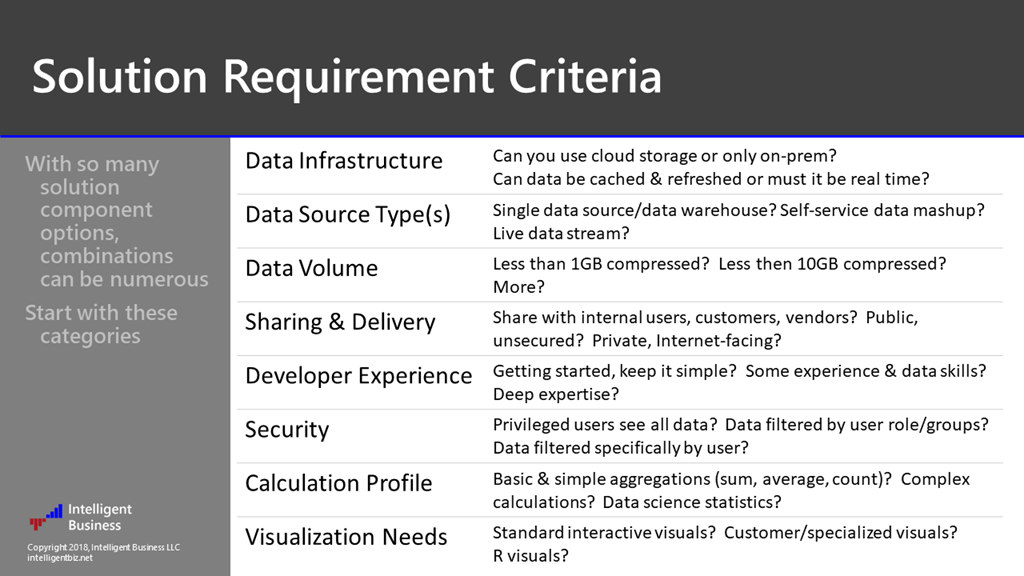
Let’s start by grouping requirements and solution criteria into eight categories. In the solution advisor, you’ll choose one option from each of these. We’ll explore these categories in detail a bit later.
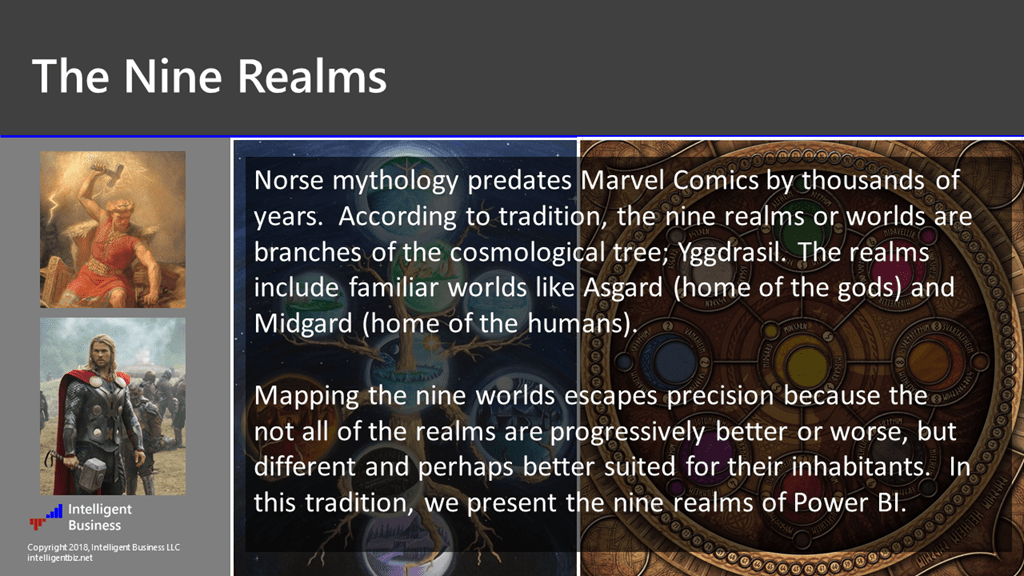
Why Nine Realms? I actually came up with nine solution architectures before the “Nine Realms” theme came to me, but I found it fitting that these concepts seems to align with the Norse mythology depicted in the Thor movies from Marvel Comics. After doing a little reading, I found that these stories have been around for centuries and are rooted in real Viking folklore that have some real substance behind them.
In short, according to tradition, the nine realms or worlds are branches of the cosmological tree; Yggdrasil. The realms include familiar worlds depicted in the stories we know, like Asgard – the home of the gods – and Midgard – home of the humans, which is earth.
Not all the worlds in the Yggdrasil tree are necessarily “better” or “worse” than, or above or below, others but they are all different, with attributes better suited for their inhabitants. I find this to be a relevant analogy.
Stay with me here and I’ll show you how this all relates to the various incarnations of Power BI solutions.
Asgard is the home of the gods and is a place resembling Utopia, or a perfect world where everything is meticulously architected and all questions have answers.
Likewise, in a perfect BI solution, every base is covered and the solution achieves something approaching perfection. Delivering such a thing is a goal of many BI solutions but achieving perfection is costly and often extends the technical scope and delivery timeline of a solution. The stresses to achieve the utopian dream of a perfect BI solution can tread practical limits of not only time and money but also of patience and sanity; stakeholder commitment, interpersonal relationships among staff and leaders, work-life balance and the overall health of team business culture.
Perhaps all this sounds a bit dramatic but if you have worked on a big BI or data warehouse project, you probably have your own dramatic stories to tell and this will strike a chord. If you have not then please learn from our experience.
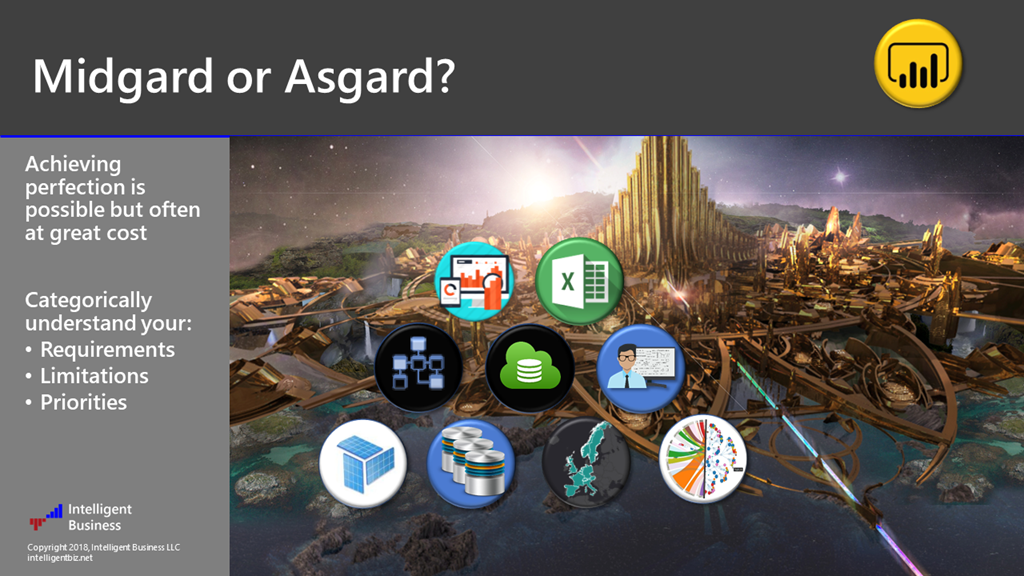
Which of the worlds is right for you and your audience? Which one of the worlds should you try to achieve?
I promise to get serious here soon, but please indulge me with the “Thor” theme for just a moment…
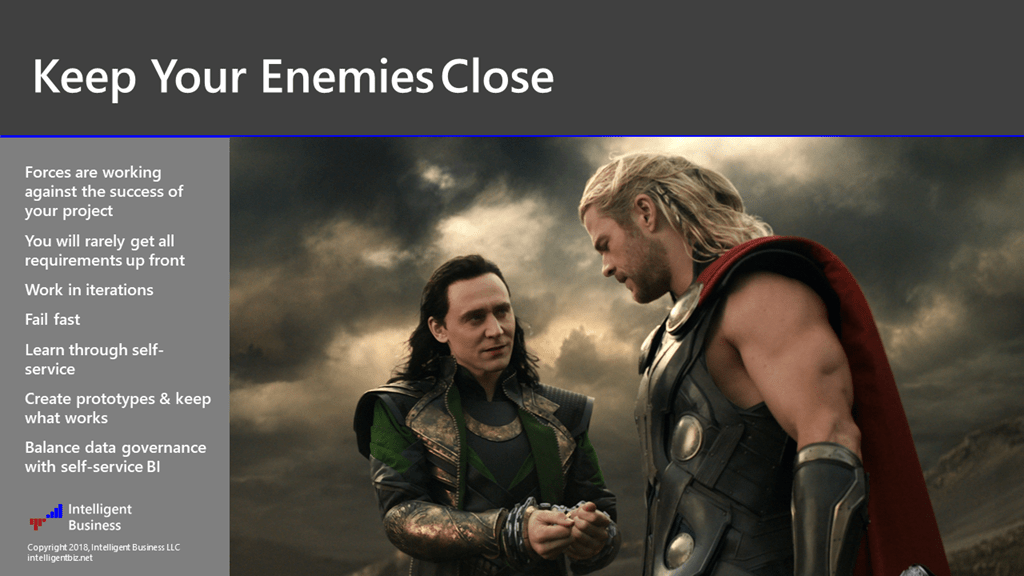
Start by understanding your capabilities and stay focused on your objectives. Keep your enemies close… in other words, understand the forces working against your success and strategically plan to overcome them.
Every distraction that deviates from of your planned solution – every new feature, every one-off promise to a stakeholder, every exception to the constrained list of in-scope deliverables – becomes your enemy. Each of these metaphoric “friends” seems welcoming and well-intentioned until the schedule slips and the list of deliverables and challenges becomes insurmountable and unobtainable within your deadlines and technical capabilities.

This slide is key…
Power BI has a rich heritage of technologies that go back many years and are deeply engrained into the desktop application and cloud service – but some of these technologies also has more capable services outside of the desktop product. For example, Power BI Desktop actually uses a scaled-down instance of SQL Server Analysis Services, which implements the Vertipaq tabular in-memory analytics engine. If you need more horsepower than the Power BI Desktop modeling component provides, you can graduate to a full-blown SSAS instance and continue to work with a very similar, but more robust, data modeling tool that will scale on-prem or to the cloud to accommodate significantly more data and richer admin controls. Be mindful, though, that making the leap from Power BI Desktop to enterprise SQL Server tools can be a big undertaking.

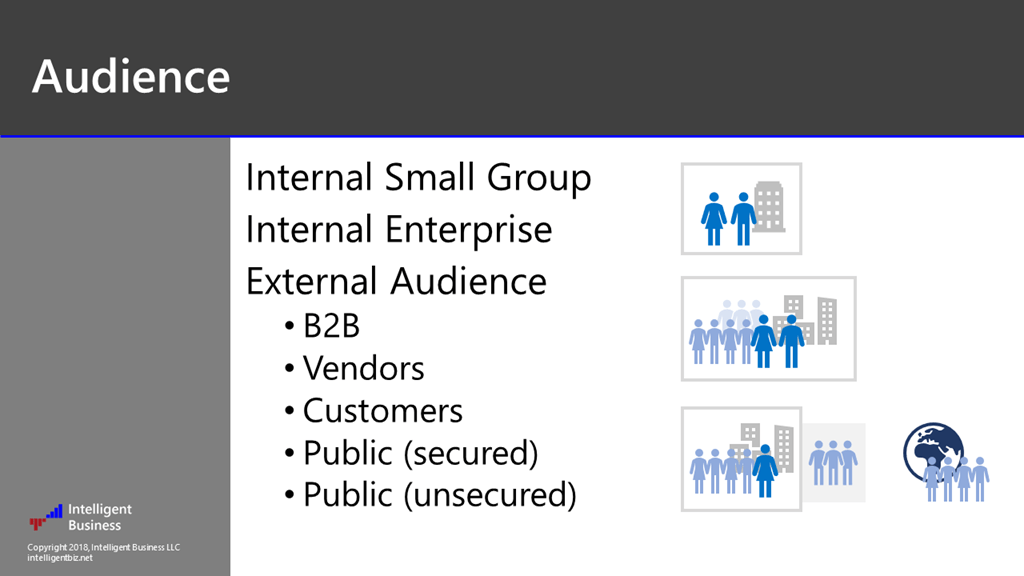
How about your audience? Who and where are they? How do you need to secure your solution, reports and data?

Where will you host your reports and how will users access them? …in the cloud using the Power BI service – or on-premises using Power BI Report Server?


The Nine Realms of Power BI
As promised, here are the Nine Realms of Power BI. They are roughly categorized into three or four different groups.
The top row are all solution options that utilize the Azure cloud-based Power BI service (PowerBI.com), with the cached data model and reports deployed to the cloud service, or with reports in the cloud and data remaining on-prem.
The second row of options are exclusively on-premises with no reliance on cloud services or cloud storage.
The seventh item, “Azure SSAS – Deployed to Service”, is entirely cloud-based and requires no on-prem infrastructure at all.
The remaining two items are special use cases where reports and dashboards are embedded into and managed by a custom application; or data is fed in real time to live visuals.

Solutions are cloud/on-prem hybrid, entirely on-prem, entirely cloud-based or specialized solutions such as embedded or live-streaming.

Now back to the solution requirement categories. Here they are in detail. Consider this like a survey. The solution advisor asks the questions on the right for each of the categories:
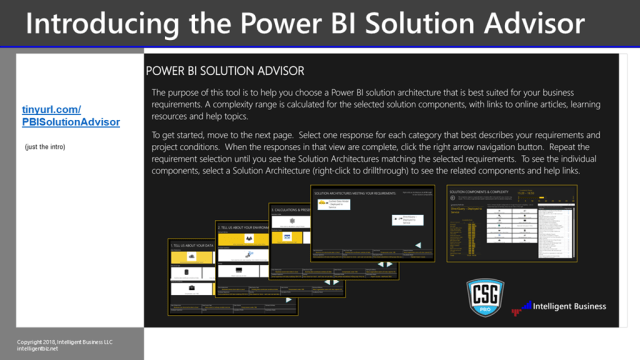
Power BI Solution Advisor
You can access the Power BI Solution Advisor by clicking the slide image.
With a little help from my friends, we have built this tool – using Power BI of course – to assess the solution requirement criteria and recommend relevant solution architectures. It was a bit of an experiment and many more factors could be considered that we built into the tool. It will guide you to a general recommendation but if you go back and try different selections, you should get a better idea of the criteria for choosing different solution options.
Let’s take a quick look at the tool and then we will explore it in detail a little later. The recommended architectures are details in the slides that follow. (3-18 update: Video Tour of the Power BI Solution Advisor). *Again, several features have been added to the service since this posting. The solution advisor uses Power BI capacity metrics as of January 2018, which may have changed.
1. Cached Data Model, Deployed to Service
For secure report sharing, Power BI Pro licenses are required for all users without Premium capacity licensing.
Premium capacity licensing covers unlimited read-only users. Pro licenses are required for publishing & sharing.

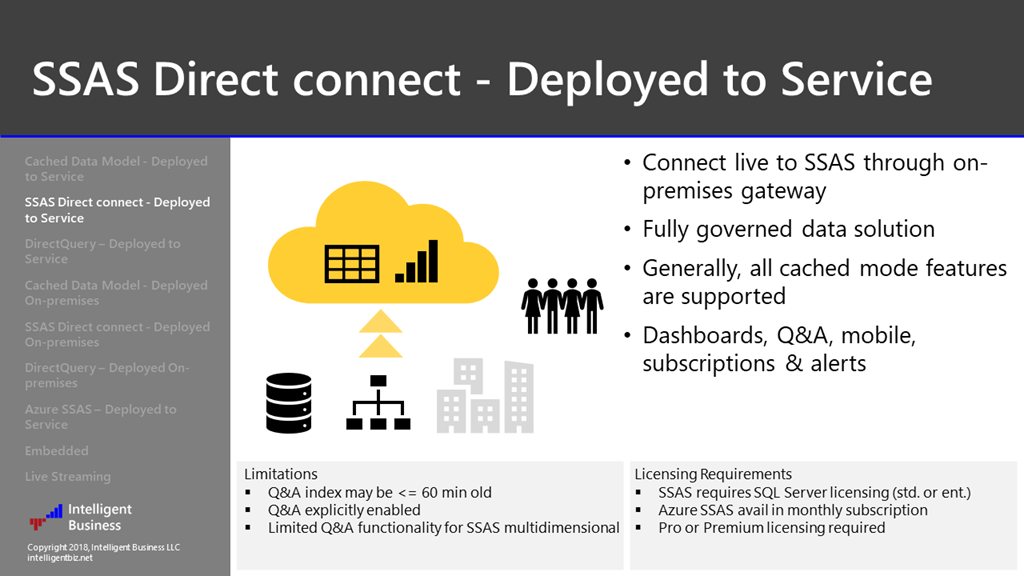
2. SSAS Direct Connect, Deployed to Service
In many respects, this is the most versatile mode for using the Power BI platform with high volume data managed on premises. The latest version of Power BI Desktop may be used with new and preview features. With reports published to the service, key features like dashboards, natural language Q&A, mobile access, alerts and subscriptions are supported. Connecting to SSAS through the gateway enables you to manage full-scale semantic models in tabular and multidimensional, using partitions for incremental data refresh. Compared to DirectQuery, this option has better performance and unlimited DAX calculation features.
In simple terms, data is read from the on-prem data model in real-time as users interact with reports; but the service is even smarter than that. To optimize performance and reduce unnecessary network traffic, query results get cached and refused for short periods.
Caching policy: https://docs.microsoft.com/en-us/power-bi/service-q-and-a-direct-query#what-data-is-cached-and-how-is-privacy-protected
3. DirectQuery, Deployed to Service
The goal of DirectQuery is to enable as much capability as possible without caching data in a persistent data model. Rather then performing calculations on in-memory tables in a Vertipaq model, report interactions are translated into native queries for the data source to process and return aggregated results. To that end, report query performance will lag and complex calculations are limited. DAX functions that consume high data volume are impacted the most (e.g. SUMMARIZE, CALCULATETABLE, YTD, PARALLELPERIOD, RANKX, etc.)
There will always be performance and functionality limits with this feature but it will likely continue to see investments to improve performance as much as feasibly possible.
DirectQuery is typically chosen when: 1) a Microsoft customer have not fully embraced cached model or SSAS modeling concepts, or 2) when a relational data warehouse/mart is performance-tuned to address specific query & report scenarios within acceptable limits.

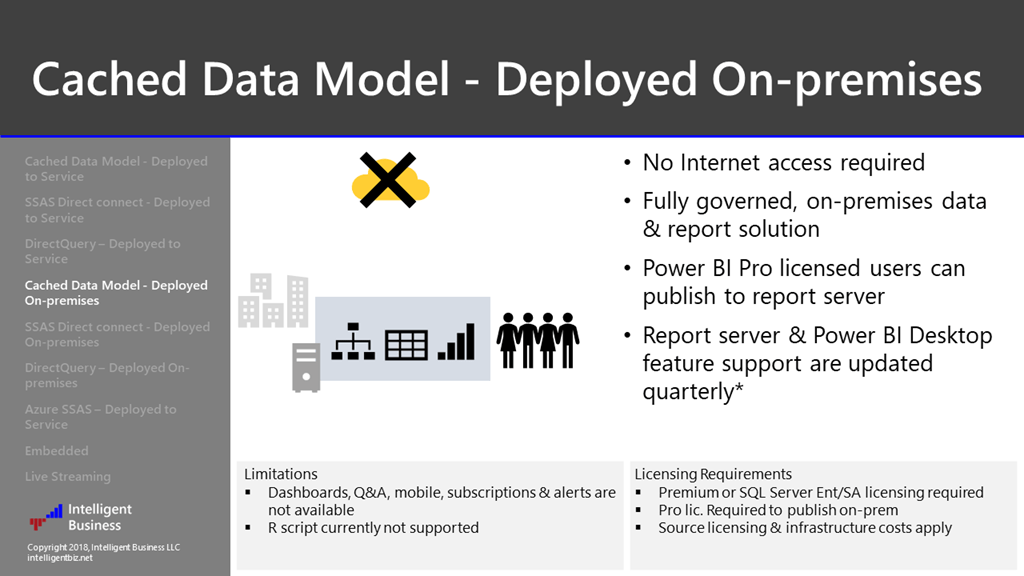
4. Cached Data Model, Deployed On-Premises
Reports are deployed to an on-premises instance SQL Server Reporting Services called “Power BI Report Server”.
SSRS catalog database requires SQL Server 2008+
Power BI Report Server licensing requirements: SQL Server Enterprise edition with Software Assurance, or Power BI Premium capacity.
Due to slower product release cycles, PBIRS features & capabilities lag behind Power BI Desktop/service by 1-4 months (PBIRS updates are about every quarter.)
User could have two version of Power BI Desktop installed (older version for PBIRS & latest version). Be cautious with version control.
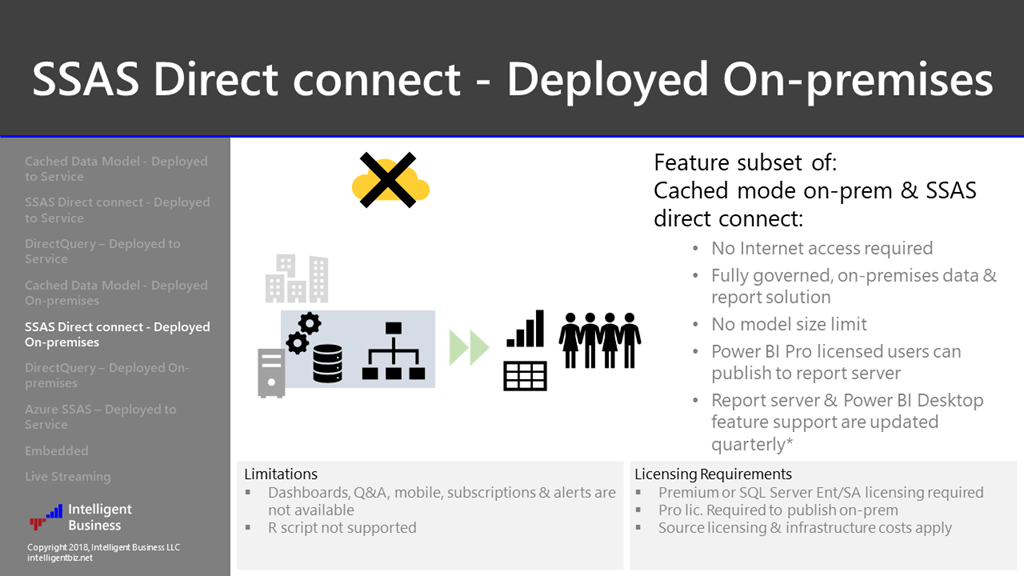
5. SSAS Direct Connect, Deployed On-Premises
This option provides for a fully-scaled out enterprise solution with no dependencies on cloud services.
No model data size limit.
Role-based, row-level security (RLS) is supported in SSAS.
Enterprise scaled architecture (PBIRS & SSAS on separate machines) will require constrained delegation/Kerberos configuration unless static credentials are stored.
Scale-out architecture is supported on each tier by load-balancing multiple SSAS machines and/or load-balancing multiple PBIRS machines.
PBIRS doesn’t support Power BI service features like dashboards, natural language Q&A, alerts, mobile app access & R visuals.
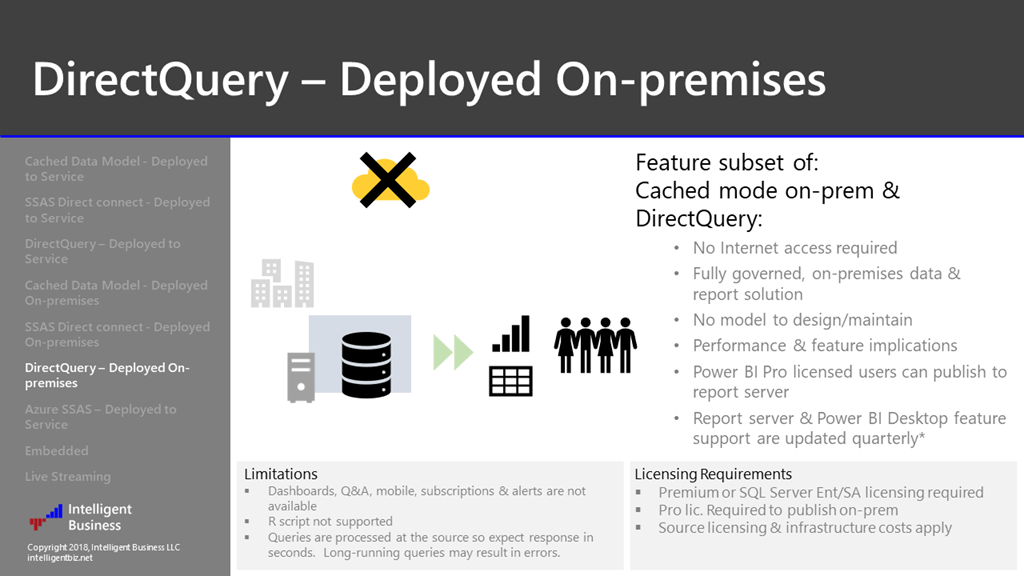
6. DirectQuery, Deployed On-Premises
This option also provides for a fully-scaled out enterprise solution with no dependencies on cloud services.
No data source size limit.
Performance degradation and DAX calculation limits apply (same as DirectQuery in the serveice).
Scale-out architecture is supported by load-balancing multiple PBIRS machines.
PBIRS doesn’t support Power BI service features like dashboards, natural language Q&A, alerts, mobile app access & R visuals.
7. Azure SSAS Direct Connect, Deployed to Service
In most respects, this option is identical to using SSAS on-premises except no gateway is required to connect to Azure SSAS.
No on-premises hardware investment is required for this option since everything is hosted in the Azure cloud.
No SSAS product licensing costs. ASSAS costs are billed for hourly usage depending on capacity & service tier (developer: $ .13, production: $ .43 to $ 20.76 per hour)
Requires Azure Active Directory which can be federated to on-premises domain.
ASSAS is tabular only, same or slightly newer build as latest boxed product (2017/1400) & support older compatibility modes.
Capabilities & features are the same as using SSAS on-prem.

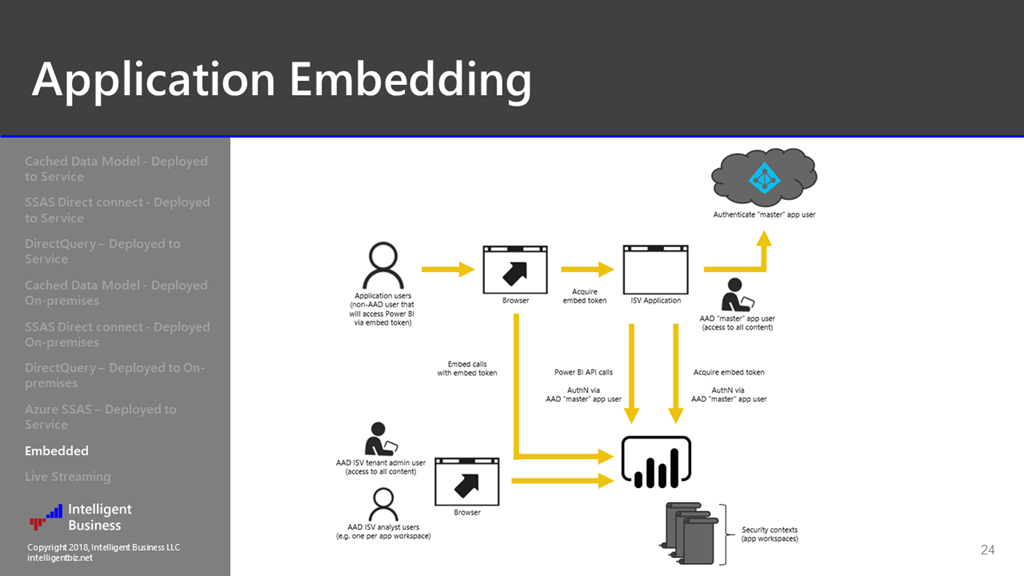
8. Embedded Service & Embedded Solutions
Power BI Embedded now supports all features of a solution deployed to the Power BI service.
Managed through Azure services in the Azure portal.
Capacity & usage-based costs range from $1 to $32 per hour.
Service may be paused & managed through the API.

This diagram depicts the components and interactions of an embedded solution.
You should understand that the options afforded you in the Power BI ecosystem are many, and even more numerous when you consider the rich set of tools are services within the Microsoft Azure, Power Suite, Office and Business solutions and other neighboring technologies. The answer to “can you do this?” is almost always “yes” but the right answer will often depend on a variety of factors. I hope this presentation has expanded your realms and helped guide you to one or a few viable options to meet your business needs.
Detailed information:
Power BI .NET SDK (server-side code): https://github.com/Microsoft/PowerBI-CSharp
Power BI JavaScript SDK (client-side code): https://github.com/Microsoft/PowerBI-JavaScript
Power BI REST API: https://msdn.microsoft.com/library/dn877544.aspx
9. Live Streaming Solutions
Streaming is a capability for developing custom solutions on top of the Power BI service.
The feature set is light and simple.
No separate licensing is required.
Streaming types & capabilities:
•Pushed dataset: Supports standard report visuals if “Historic data analysis” is switched on; caches data in a dynamically-created Azure SQL database.
•Streaming dataset: Does not store data… only dashboard tiles are supported. Push from REST API or as endpoint from streaming service, like Azure Stream Analytics.
•PubNub: Streaming dataset tailored to consume standard PubNub channels.

Now for a deeper-dive look at the Power BI Solution Advisor…
This project is a work-in-progress that can used to provide direction and to explore solution options.
It is not perfect or comprehensive but can help recommend solution architectures based on chosen requirements and solution criteria.
The second page uses bookmarks to navigate through the requirement category slicers and display candidate solution architectures.
Right-click a solution architecture “tile” to drill-through to components and help links.
On the final page:
The relative complexity of the chosen solution is estimated, based on selected components.
Select any combination of components to see related help topics and links to articles & resources.

Again, I need to credit my friends at CSG Pro in the Portland area, for teaming up to build this tool. It was an entry in a recent Power BI Hackathon. CSG Pro hosts our monthly Power BI User Group meetings on the 4th Wednesday evening of the month in Beaverton, OR.
You can learn more about their consulting and development services at CGSPro.com
If you would like to download a copy of the presentation slide desk, it’s here: https://sqlserverbi.blog/wp-content/uploads/2018/02/nine-realms-of-power-bi.pdf. Feel free to use it as long as you keep all content intact including my contact information and copyright info. As always, your comments and questions are welcome.


A Gerber -madе full- tang ѕurvivzl knifе.
Is there a reason why the pictures of use-case 1 and 2 are the same?
The images are not the same. Cached models and SSAS direct connect are quite different. If I have misunderstood your point, please explain.
Would it be possible to share the pbix file for Power Bi solution advisor?
The foundations are strong. PBI will become a haven for all peoples…
You’re inspired!!!
PAul, Thats a great deck of slides for a ‘Power BI Solution Advisor’ to use. thanks for sharing. cheers @wottabyte