
Attending the PASS Business Analytics Conference last week reminded me once again that the most-used data analysis tool in the world is Excel. This isn’t startling news but it is an important reality that can be easy to ignore until being reminded that users usually want to WORK with their data rather then just seeing their data.
Following are some take-aways and thoughts from the PASS BAC event and recent news on the Excel and Power BI front…
Power BI – Analyze in Excel
– this new capability in Power BI and Excel for many users completes the cycle and brings the product full circle. I’ve built a lot of Power BI solutions in the past year or so, and the most recognized request from users and stakeholders was that they wanted to know how to work with the data in Excel. There are a few related features that make this a reality today.
Analyze in Excel is a feature of the Power BI service that allows data in a Power BI model to be (you guessed it…) analyzed in Excel. More specifically, choosing this option (by clicking a link) opens Excel on your desktop, creates an ODC file containing connection information for the Power BI as a data source and creates a Pivot Table in the new Excel workbook – all automagically and without user interaction.

At this point, Excel has a live connection to the Power BI model just like any data source (cube or tabular model). Just add fields to the pivot table… use normal Excel features; add charts, filters, slicers, you name it. Just do what you do with Excel and it works with your Power BI model data.

This a great for consuming a published Power BI model as a single source of truth in a tool that users know and love to use.
Here’s the cool thing… Power BI can use Excel visuals as dashboard content. You can pin Pivot Tables, Pivot Charts and entire worksheet selections to a Power BI dashboard tile. To do this, save the Excel workbook to the OneDrive associated with the Power BI subscription. Now that Excel can consume the Power BI model as a client, using these features together makes Power BI and Excel part of the same ecosystem and extends the power of the platform rather than just more features of the individual tools.
A companion feature of Excel 2016, Publish to Power BI, makes it much easier to push content to a Power BI subscription.
Tutorial: Use Excel Reports in Published Power BI Subscription
Third Party Power BI Vendor Support
As a fairly new entry in self-service BI and analytics space, we’re all watching Power BI. Adoption has been impressive as has been Microsoft’s commitment and investment into the platform. Another heathy sign of any new platform is the investment of vendors. I’m not endorsing anything but just making some observations. At the conference, I saw several new third-party additions for Power BI and I’ll share a few as examples:
Pyramid Analytics – Publish PBIX content on-premises
Pyramid Analytics has one of the most comprehensive add-on products for SQL Server Analysis Services. It’s an entire suite of server-based visual and reporting tools, along with narrative report authoring and self-service tools that leverage the depth of SSAS and MDX functionality. Pyramid announced their intent to provide on-premises Power BI publishing in their product last summer and have been working to deliver on what should be available in the next couple of weeks, based on internal build demos I saw at the conference. This will the first offering for an on-prem collaborative Power BI solution.
PowerON BI – Write-back to Power BI and SSAS tabular for forecasting and planning
I’ve used the Power Update tool from Power On in the past. When I saw the Power Planner demonstrated, the simplicity and ease-of-use just knocked my socks off. The ability to write-back forecast data and report on real-time “what-if” scenarios has been a difficult to achieve holy grail in the Microsoft BI space but these guys have it right. The concept is amazingly simple: in a PivotTable, change the total of any calculated or aggregated measure. The contributing details and subtotals are proportionally recalculated and written back into the model’s data source and then then refreshed. Large models using SSAS tabular use small partitions to isolate changes. We’ve built custom solutions to address specific user requirements using a similar architectural approach (with considerable effort) but this tool seems to be flexible enough for different use cases. They’ve also created custom visuals that allow data changes to be applied using Power BI visual charts and tables. Quite nice.
Adam Saxton (aka Guy In A Cube) reviews Power ON BI during his coverage at the PASS Business Analytics Conference.
Custom Visuals – from the community contributors or roll-your-own visuals
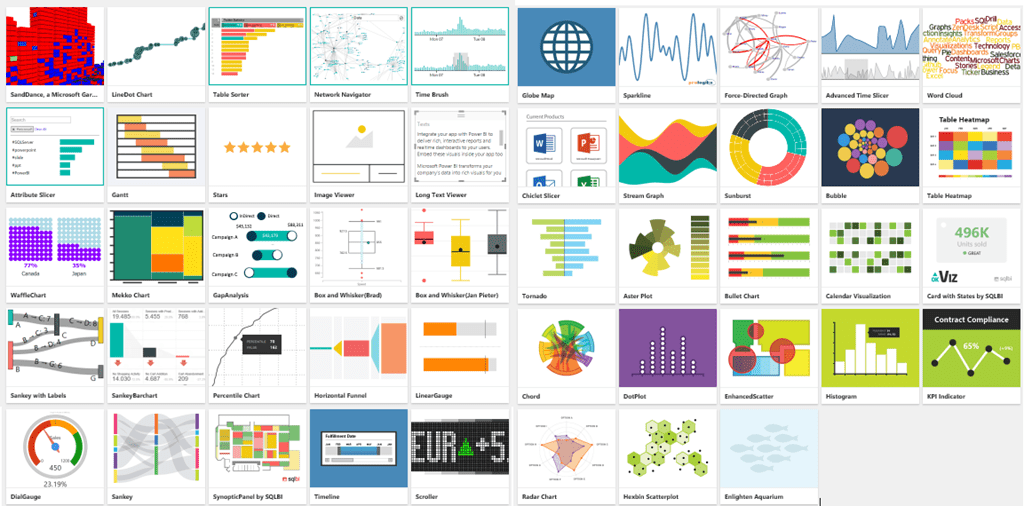
In the Fall, the Power BI product team opened the visuals API and provided a development toolkit with sample code in GitHub projects. Several individuals and companies responded, along with Microsoft, to create 48 (so far) new custom visuals that can be used by any Power BI user to extend their solutions. A recent entry is the Long Text Viewer that describes a Power BI query in verbose text. This is a useful for documenting the context of reports and visuals.
Additionally, a new set of Excel-based custom app visuals are in the works from the Excel teams and community.

Very interesting and informative
David, although Power BI does make a good sidekick, I’d have to say that often times it is the hero.
I believe you are right, Brent but I’ve pinged the product team to confirm. The “which feature belongs to which edition” documentation usually take longer to update than the weekly service refresh.
Paul- Good stuff here. I also liked the video. Just thought I would point out a licensing limitation for the “Analyze in Excel” functionality. I believe it is only available to the Power BI user who published the data model and any Power BI “fee” users that have been shared the data model. It is not available to a Power BI “free” user to whom the data model has been shared. Do you agree?
I’d say robin is power bi.