I’m working on a series of articles about creating enterprise solutions with Power BI and the first article was published this past week in SQL Server Pro Magazine. I will republish the completed series but until then, I’ll post short excerpts from each article. In future posts, I’ll show examples and demonstrations.
First article:
Power BI Solutions for the Enterprise – Part 1
Power BI is a bona fide sensation. It’s only been about seven months since the rebooted version 2 release and transition from Office 365 to PowerBI.com and Power BI Desktop. Since that time, Gartner has moved Microsoft to a leading position on the Magic Quadrant for Business Intelligence and Analytics Platforms. Like a young, prized race horse sprinting to the lead from the center of the pack; Power BI is being taken seriously and bigger players are considering the right timing to place bets.
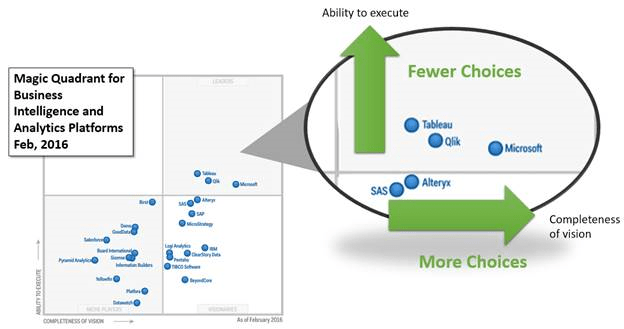
Microsoft is rated by Gartner as the having the most complete vision while Tableau and Qlik rate slightly higher in their ability to implement. This makes perfect sense to me as “Microsoft BI” is not one simple product choice. This is my opinion: The Microsoft BI platform has many components and offers many choices, but is certainly comprehensive and scalable. Microsoft have always erred on the side of offering choices where some competitors have a monolithic product. Power BI is great single-product solution for simple projects, and with room to grow as needed. At scale, Power BI is delivering “the last mile” of data visualization beautifully on top of the robust foundation of SQL Server, Analysis Services, Integration Services, HDInsight, Stream Analytics, machine learning and all the other Azure services.
Three months ago I attended the first meeting of a new Power BI MeetUp group in Portland, Oregon. Last week we had a full house. Power BI groups are popping up all over the world as users, businesses and BI practitioners are embracing this product. The Power BI Community site currently lists 59 user groups! Capabilities added to the product each month are numerous and pace of development is increasing. The first wave mainly focused on features for self-service users and small group scenarios. The next wave will address larger-scale scenarios, security, administration and developer tools for integration. The SQL Server and BI product teams have made their intentions clear in recent announcements. Jen Underwood’s article, “Top Takeaways from Microsoft’s Reporting Roadmap” last month underscored that the new BI platform will address big business solutions in the cloud and on premises. We’ve seen tremendous momentum but there is more progress to be made.

Simon, indeed very similar – but Fredriks chart is better.
Could it be that we come from the same country 🙂
I wonder where he get the data…. (one of Tableau’s data points are wrong).
Yes, thanks. It’s my first try with Power BI.
I follow your blog great interest, so sharing it is the least I can do.
I used PowerQuery to collect the data from a Tableau report (link below).
I’ve tested to embedded it on my blogg, and in a ppt-slide, and it works fine. Even to put a .pbix copy on OneDrive.
I don’t know what else to say… the rest is just code.
—-
Source data:
https://public.tableau.com/views/GartnerMagicQuadrant/GartnerMagicQuadrant?:embed=y&:showVizHome=no&utm_medium=website&utm_source=Tableau+Public&utm_campaign=Gartner%27s+2015+Quadrant&utm_content=:&UC.cid=WTPGQ2015&WT.mc_id=WTPGQ2015
Gartner 2010 – today:
https://app.powerbi.com/view?r=eyJrIjoiOWEwZDQwYjktN2Q3MS00MDhkLTllMGItNWE5ZWFhNjE0MzUyIiwidCI6IjdjM2Q2MGVmLWViN2YtNDc3Mi1hMDRkLTlkMzFlMmYyOWJiZSIsImMiOjR9
Ola, this I a very impressive Power BI report. Please provide some background ad I’ll be happy to promote it. Did you prepare this?
Look like a partial copy of the report by Fredrik Hedenström: http://www.fredrikhedenstrom.com/2016/02/16/gartners-bi-magic-quadrant-visualized-in-power-bi/