I like maps. They put things into perspective and usually let you know where you’re going and how to get there. We all use mapping services like Google, Bing and MapQuest on our computers and devices these days to get directions. Real men use maps and don’t stop to ask for directions!
After Microsoft added geospatial data support to SQL Server 2008, they added the Map report item to Reporting Services in SQL Server 2008 R2 which was released in 2010. Map reports have been part of some of my client reporting projects in the past couple of years and I’ve been able to employ a lot of interesting and useful visual effects. Using SSRS, you can draw shapes and boundaries from line, polygon and point data stored in a database or shape files. You can fill geographic areas with different colors to represent some kind of comparative value and you can show the location of pretty much anything using custom graphics, shapes and point icons built into the reporting tool. That’s all cool and it all works as promised. However, the maps in Reporting Services are not particularly interactive and they can be a bit cumbersome to design and debug given the sheer number of properties exposed by the report design interface. It’s even possible to zoom and move the view around to some degree but each navigation requires a round trip to the report server so the user experience isn’t real snappy. I’ve spent a lot of late nights tweaking SSRS maps designs to deliver seemingly simple maps that took many hours to finish.
Enter Power View 2013. When Power View (or “Project Crescent”) was released earlier this year in SQL Server 2012 integrated with SharePoint 2010 Enterprise Edition, we saw some good, basic interactive visual capabilities. By dragging and dropping fields from a list in the SharePoint, browser-hosted window, you can create some cool charts and tables that automatically filter data when you click on data points. The next version of Power View will also be available in Excel, as an add-in, with a bunch of new visual capabilities including a new Map component. Some quick experimenting in PowerPivot and Power View revealed just how convenient and powerful this new mapping tool really is.
Power View 2013 Maps
My first map test was with an existing PowerPivot model that had plenty of numeric data that could be group by US states. The same kind of aggregate grouping should work with the names of continents, countries, provinces or city names that are known by the Bing Map service. I used the FAA model that Robert Bruckner prepared for the chapters he wrote in our Professional SQL Server 2012 Reporting Services book. This data is freely available from the book samples and support site at Wrox.com. The data set contains statistical information about airline flight delays and wildlife incidents involving aircraft.
I learn something interesting every time I look at this data. Like, for instance, that airplanes run into a lot of Canadian Geese in the United States. In 1999, there were five airstrikes in California involving domestic cats and a Frontier Airlines jet ran over a badger once in Colorado.

This data also shows that a 747 fairs much better, with considerably less damage, when opposed by a flock of sparrows than a Cessna 150 in Alaska with a Bull Moose. No big surprise there.
One of the impressive things about the Power View map, compared to the SSRS report item, is that it responds instantaneously to data changes. As I click on different animal names in the slicer, it takes Power View less than a second to zoom and pan the map to show only the area containing applicable data. Way cool!
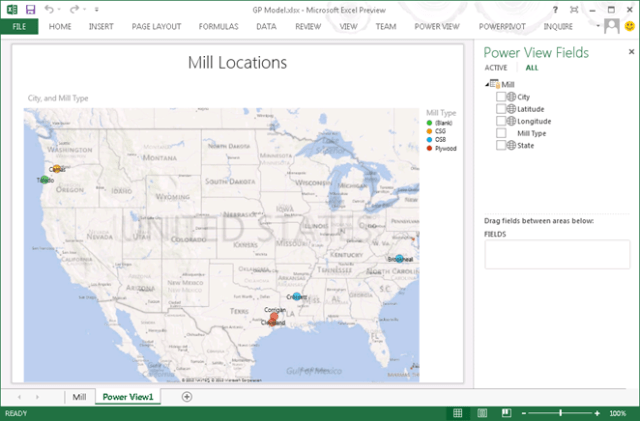
The next test was for point data. For this I created a new Excel workbook. I looked up the locations, latitude and longitude, of some paper mills located in US towns. With the table selected, on the POWERPIVOT ribbon, I clicked Add Data to Data Model. This created a new PowerPivot model.

On the INSERT ribbon, I added a Power View report and selected the fields to create a table of data on the report. I click Map in the DESIGN ribbon and Power View just figured out how to visualize these locations. It literally took a few seconds to have a working map report with the locations plotted on the map. I tweaked it a little but the tool really did all the work for me. I’m very impressed.
Since this model is very simple and the column names were intuitive, the designer was able to automatically assign the right metadata. Here is a view of the PowerPivot model showing the field metadata in the Advanced tab. You can see that it used the field name and data type of the Latitude column to figure out that it contained latitude data. If this wasn’t the case, these settings might have to be set manually.

Conclusion
With very little effort I was able to visualize geographic data in two different ways. The first was to display an aggregate result grouped by US state from an existing PowerPivot model that presented statistical information rolled-up by the name of a geographic region. Using the Bing Map service, Power View matched up the state names and then aggregated a selected field to show a bubble on the map in the center of each state. The second visual used the latitude and longitude stored in the model, derived from an Excel worksheet, to show the position on the map. Again, the Bing Map service was used to geocode the data on the fly with no user intervention whatsoever. Piece of Pie!
*Yes, the traditional phrases are “Easy as Pie” and “Piece of Cake”… a nod to memorable moments in the 1984 Movie, “2010”.
*Yes, the traditional phrases are “Easy as Pie” and “Piece of Cake”… a nod memorable moments in the 1984 Movie, “2010”.


Hi Paul,
Can you advise if the SM SQL Suite has the ability to capture & visualise geographic Data within a building. Do the data types have the precision?
Thanks
James